published: 22 August 2021 ...... last updated: 14 April 2022
All graphs herein are the work, property, and copyright of Dr. Michael Levitt of Stanford University. Other contributers to the underlying work are Franceso Zonta and Andrea Scaiewicz. All quotes are Dr. Michael Levitt's direct from the linked Tweet of his Twitter account. All other notes are my own.
SOURCES for all data used for calculations of mortality
Dr. Michael Levitt's reliable EXCESS DEATH METHODS and analysis are robust and trustworthy, accounting for differences in age-banded mortality rates and trends, seasonal offsets, and reporting capacities and delays. This makes it more accurate than other popular Covid era excess death estimates from places like Our World in Data, Euromomo, and the CDC. Dr. Levitt's initial range of estimates that still hold true today were first made public with his analysis of the Covid outbreak on the Diamond Princess in March and April 2020on Twitter
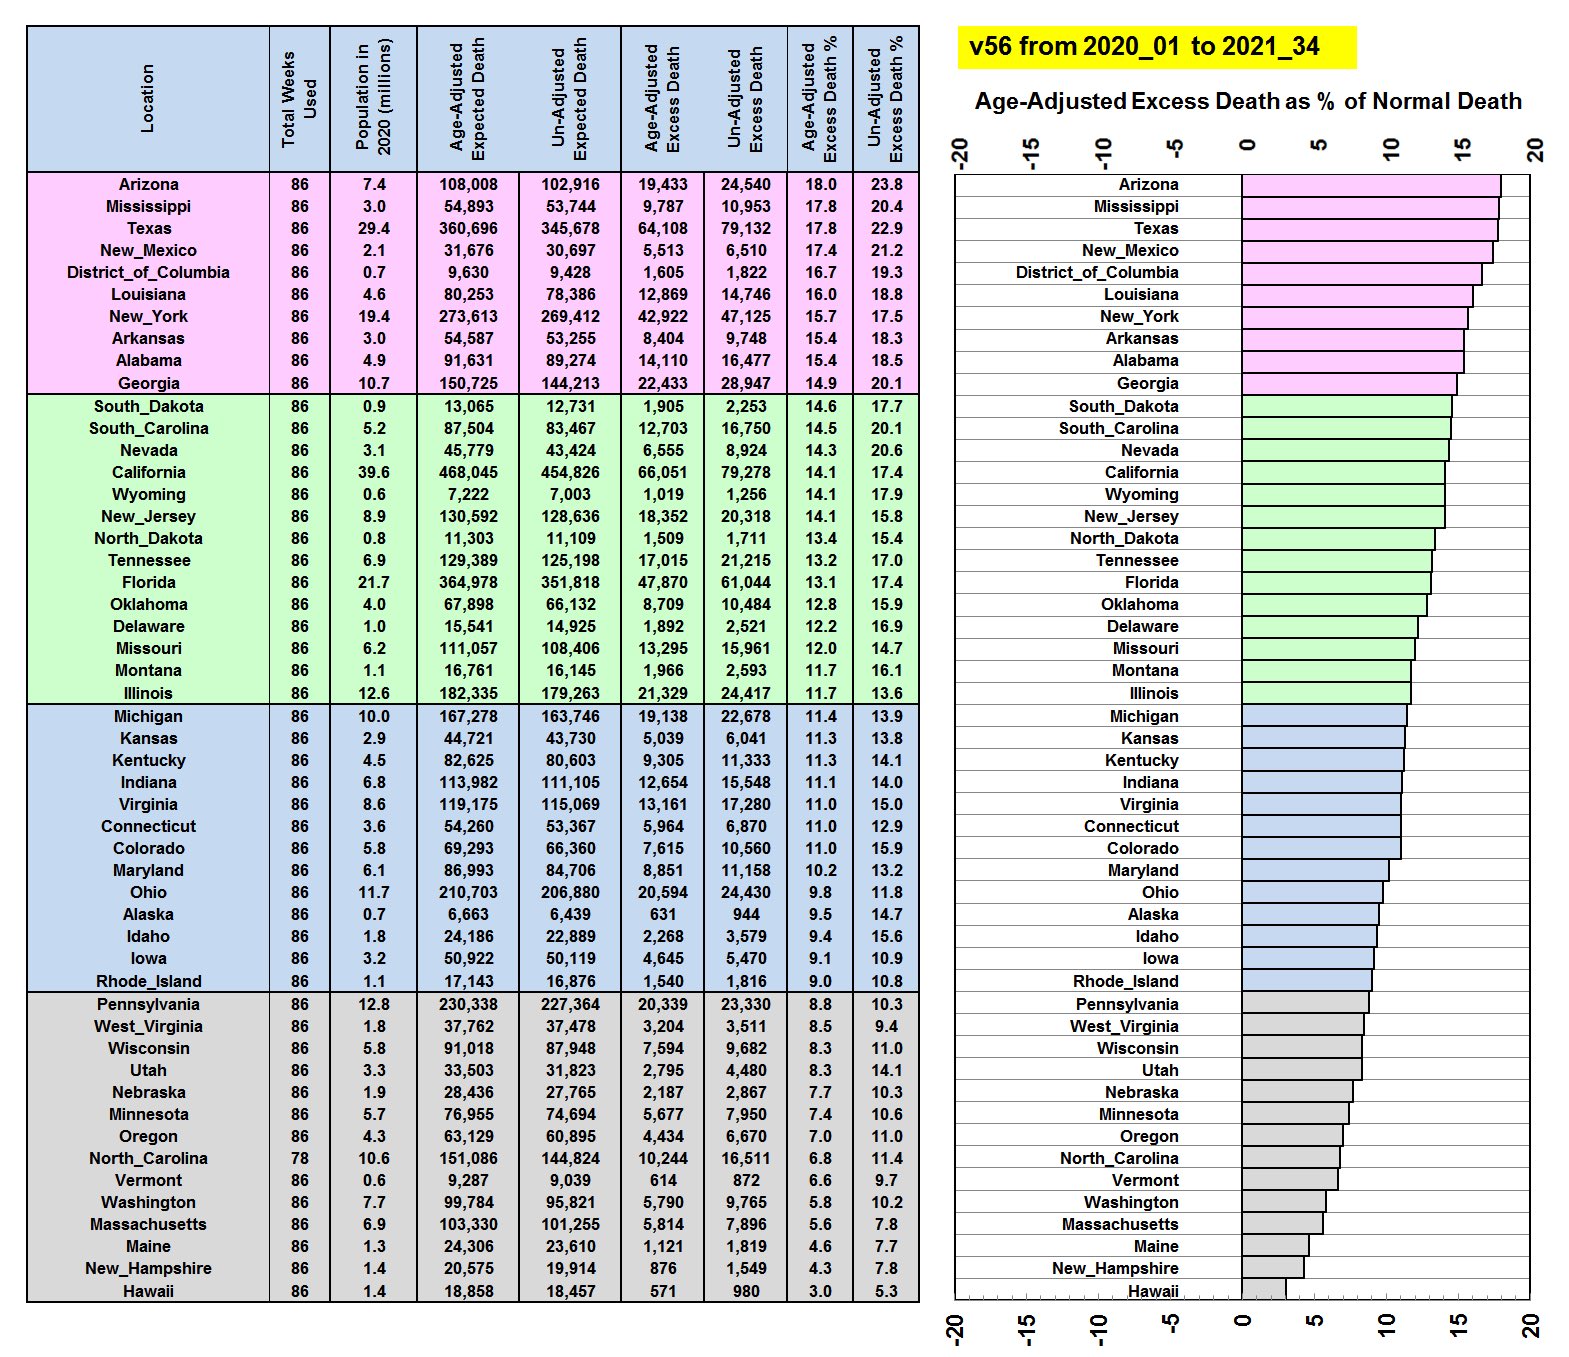
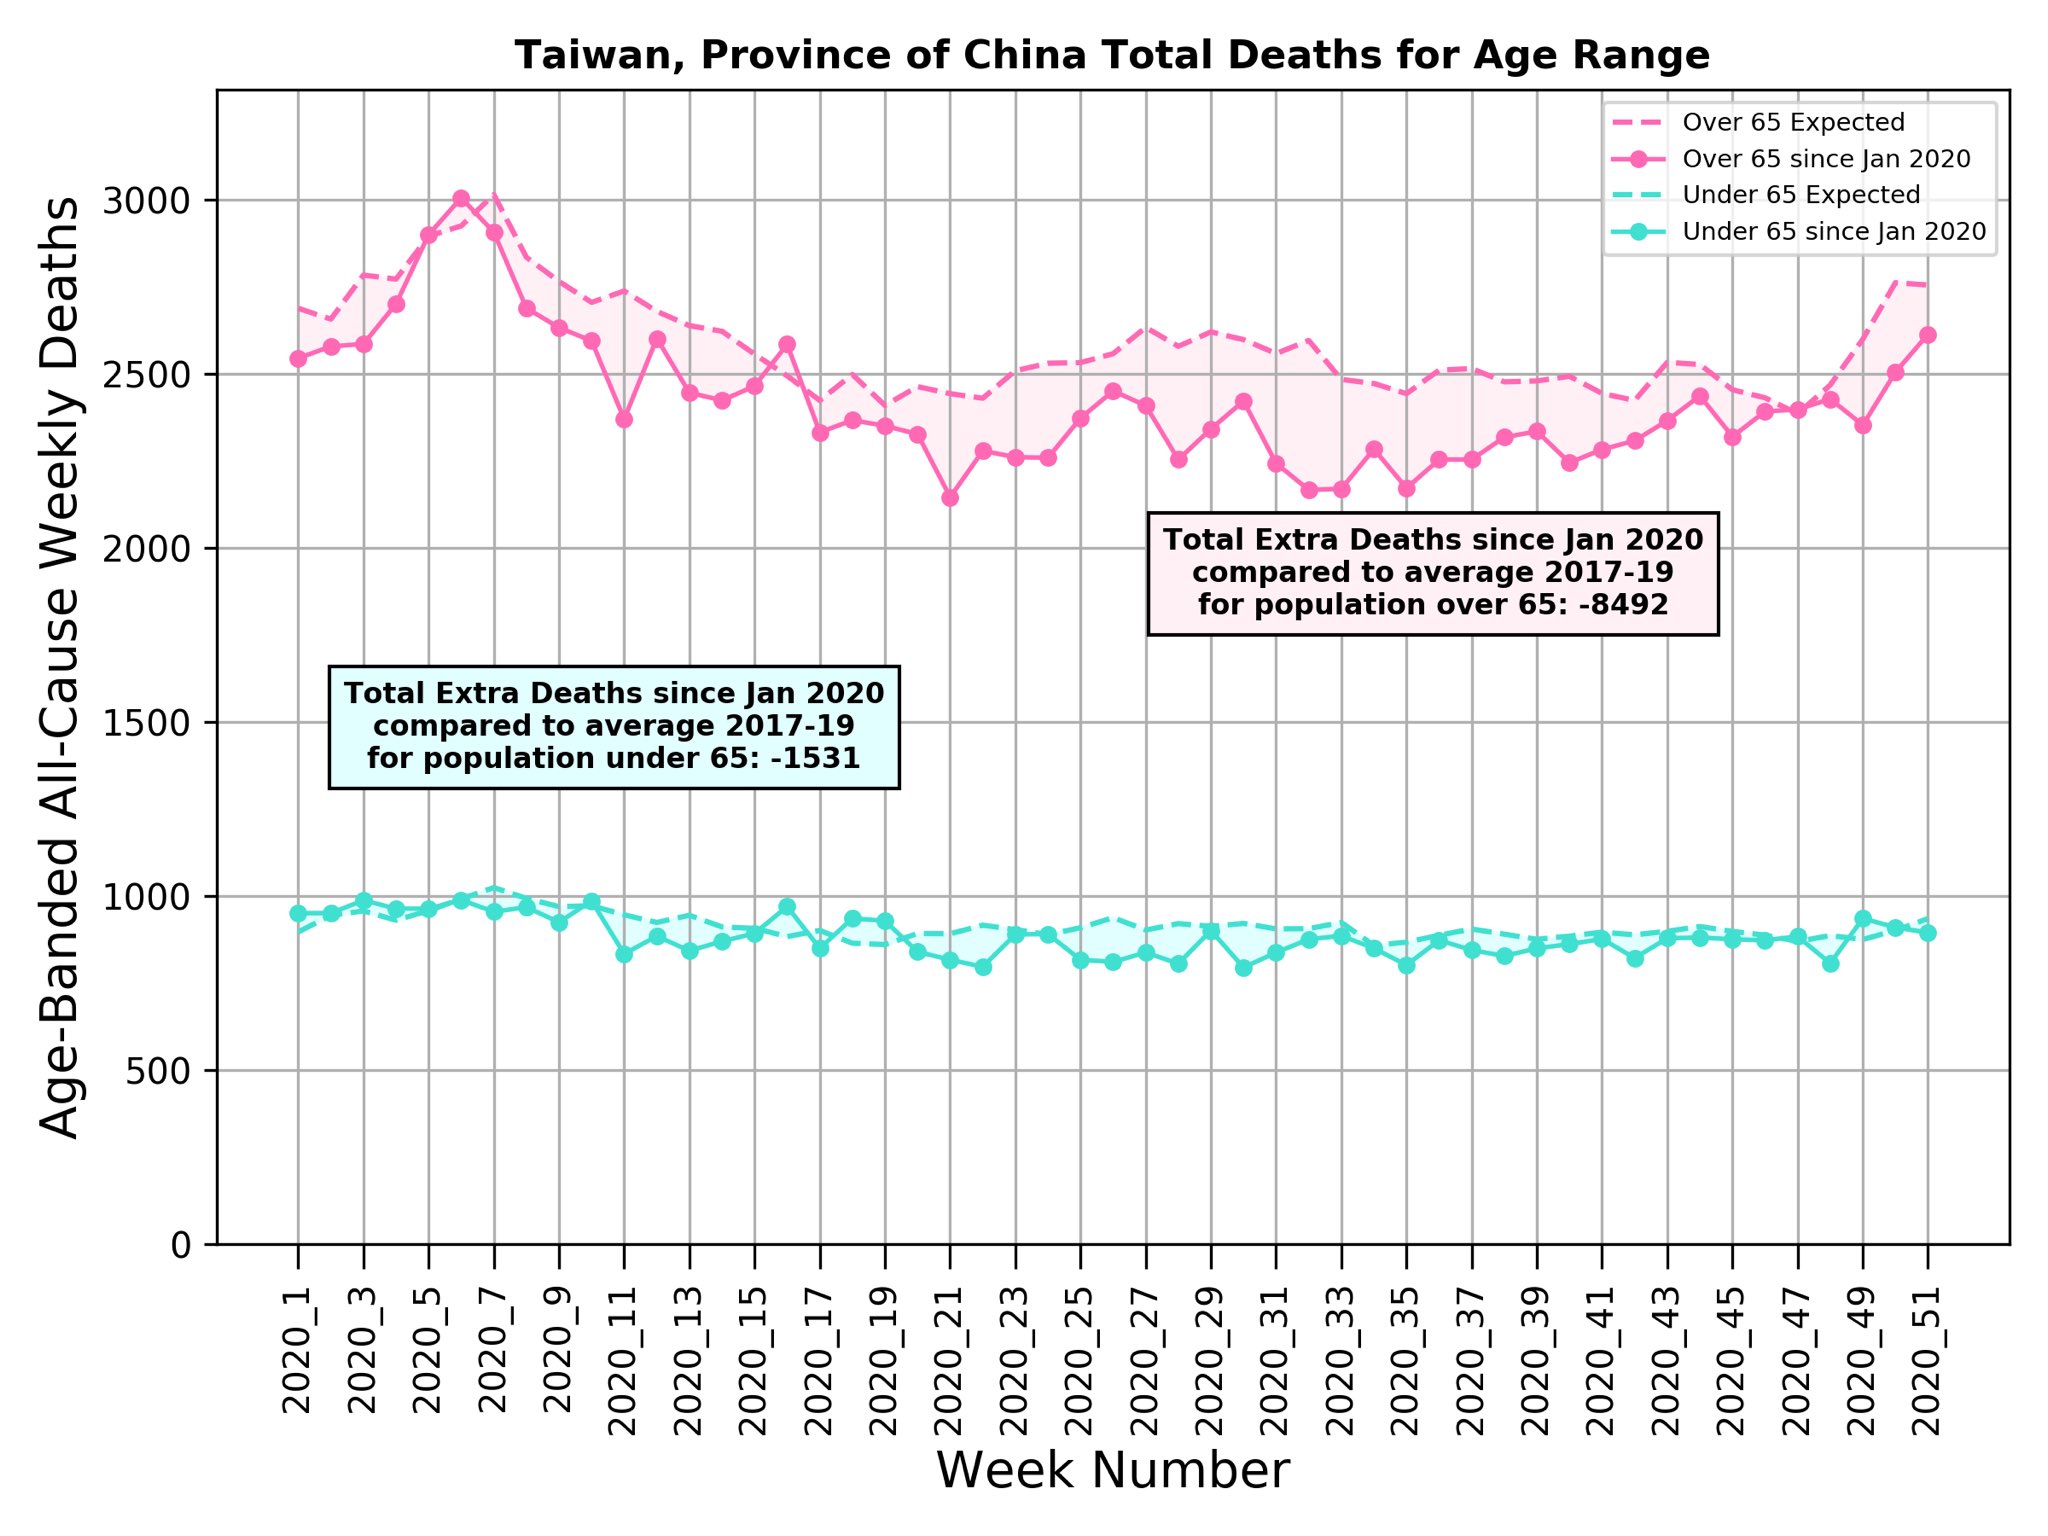
Note: Age-adjusted expected and excess death, with excess death shown as a percentage of expected death. If the bars in the graph are going to the right they are showing excess, if to the left they show a deficit. All of the United States currently show excess.
Listed in order of highest amounts of excess death (top) to lowest (bottom)
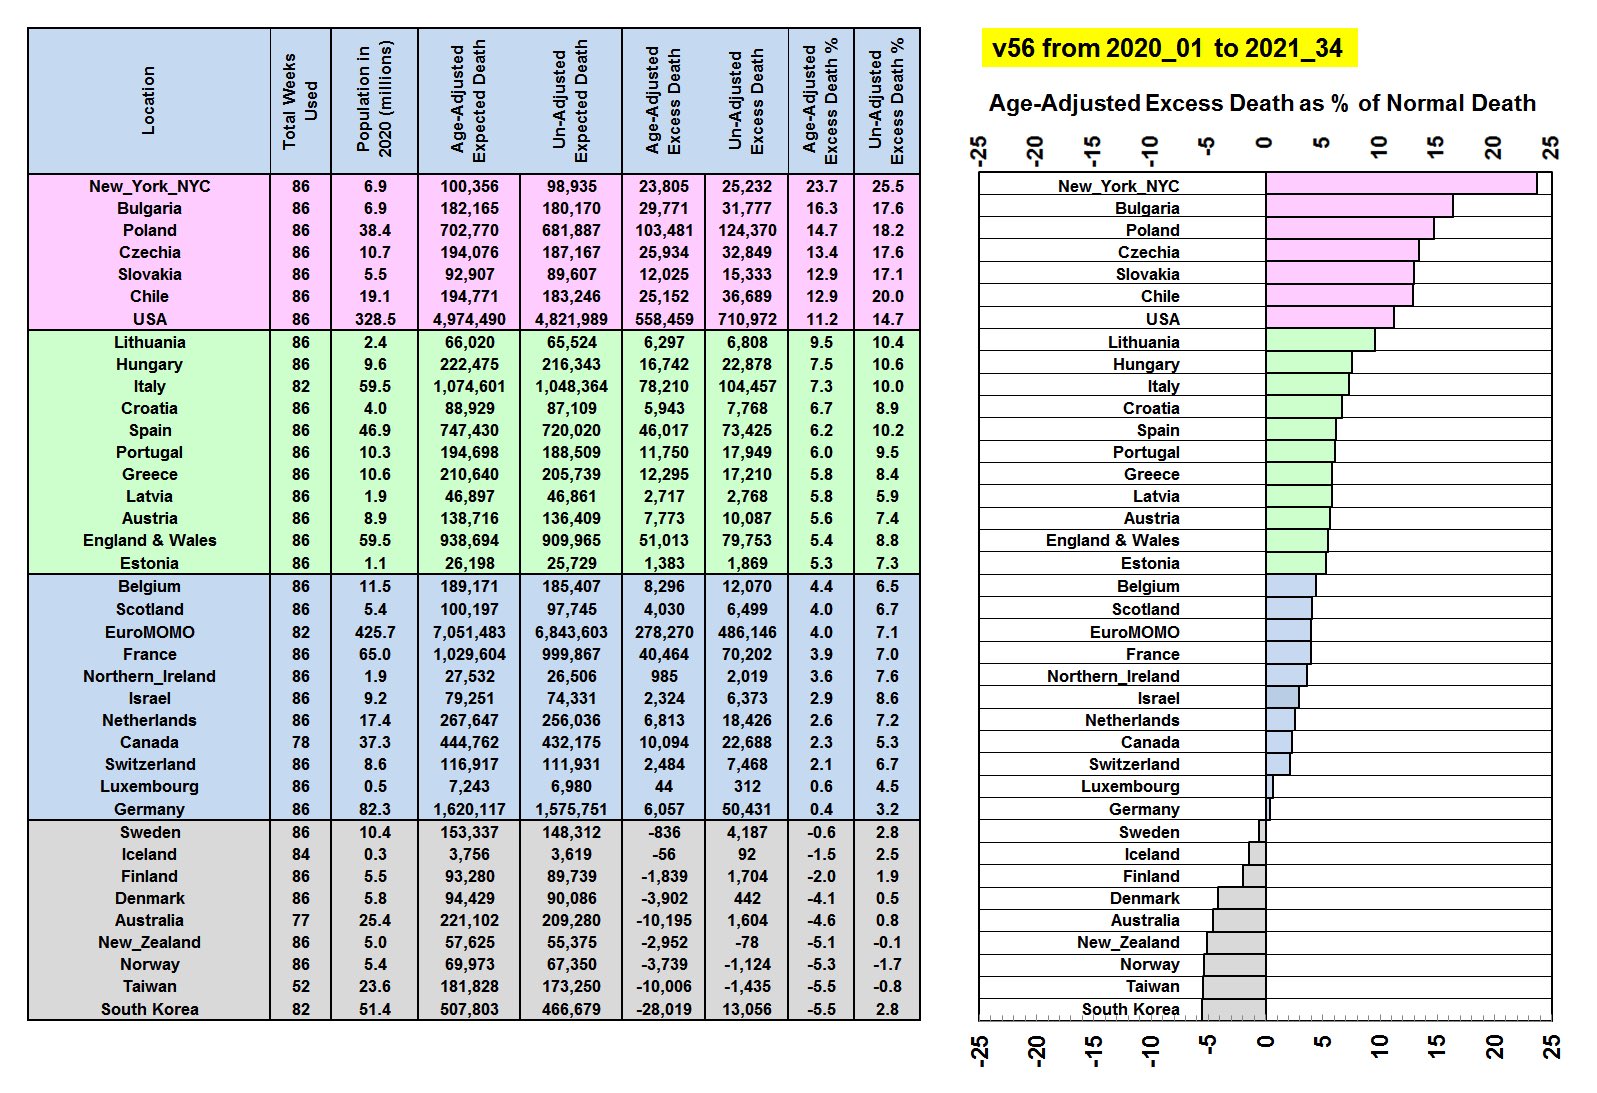
Note: Age-adjusted expected and excess death, with excess death shown as a percentage of expected death. If the bars in the graph are going to the right they are showing excess, if to the left they show a deficit. Sweden, Iceland, Finland, Denmark, Norway, Australia, New Zealand, Taiwan and South Korea have a death deficit.
Listed in order of highest amounts of excess death (top) to lowest (bottom)
Week 34 (29 Aug) 2021
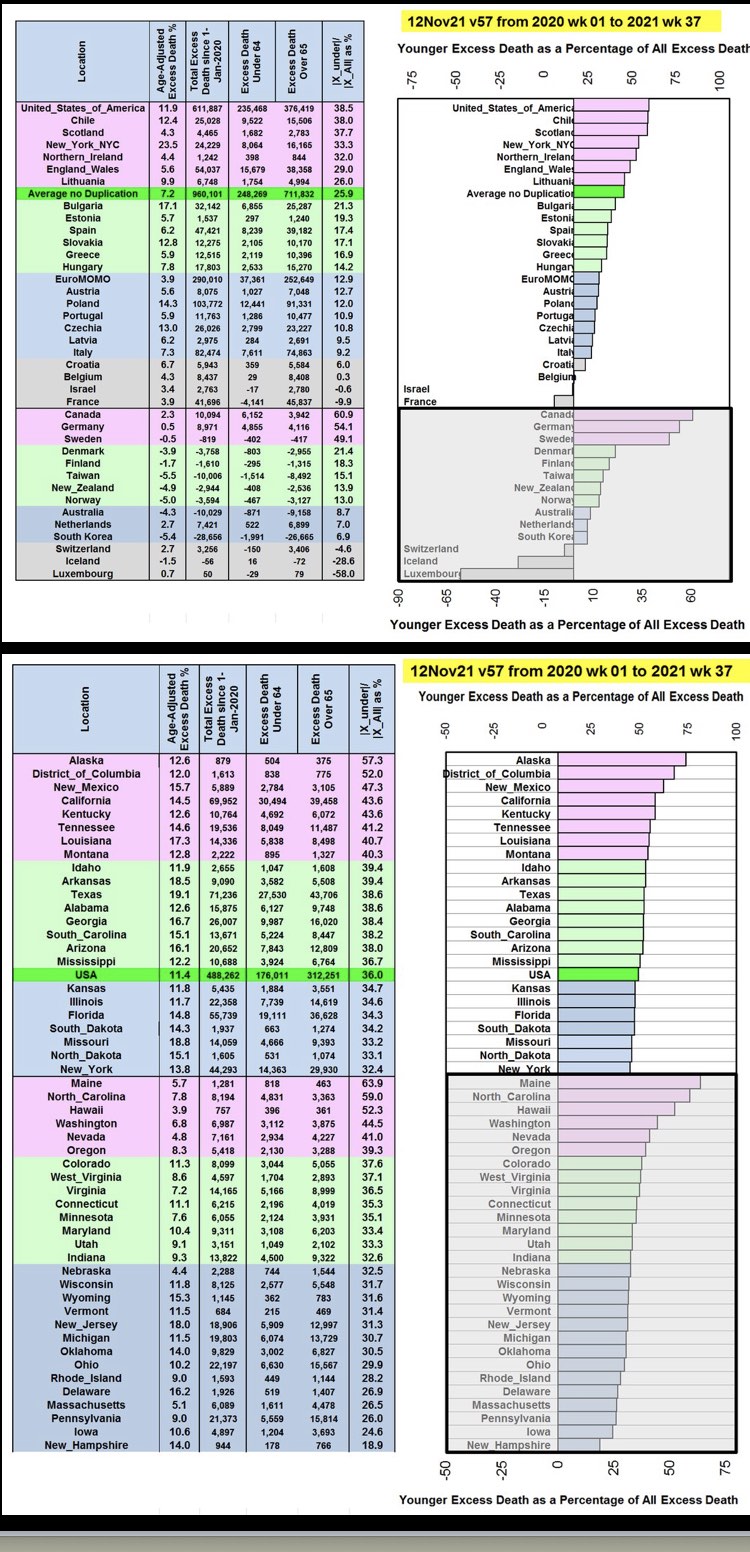
Comparison of Excess Death under age 65 as a percent of Total Excess Death
NOTE: Use either the scale at bottom of the graph, or the far-right column in chart for youth excess death as a percent of all excess death.
Week 37 2021 (19 Sep)
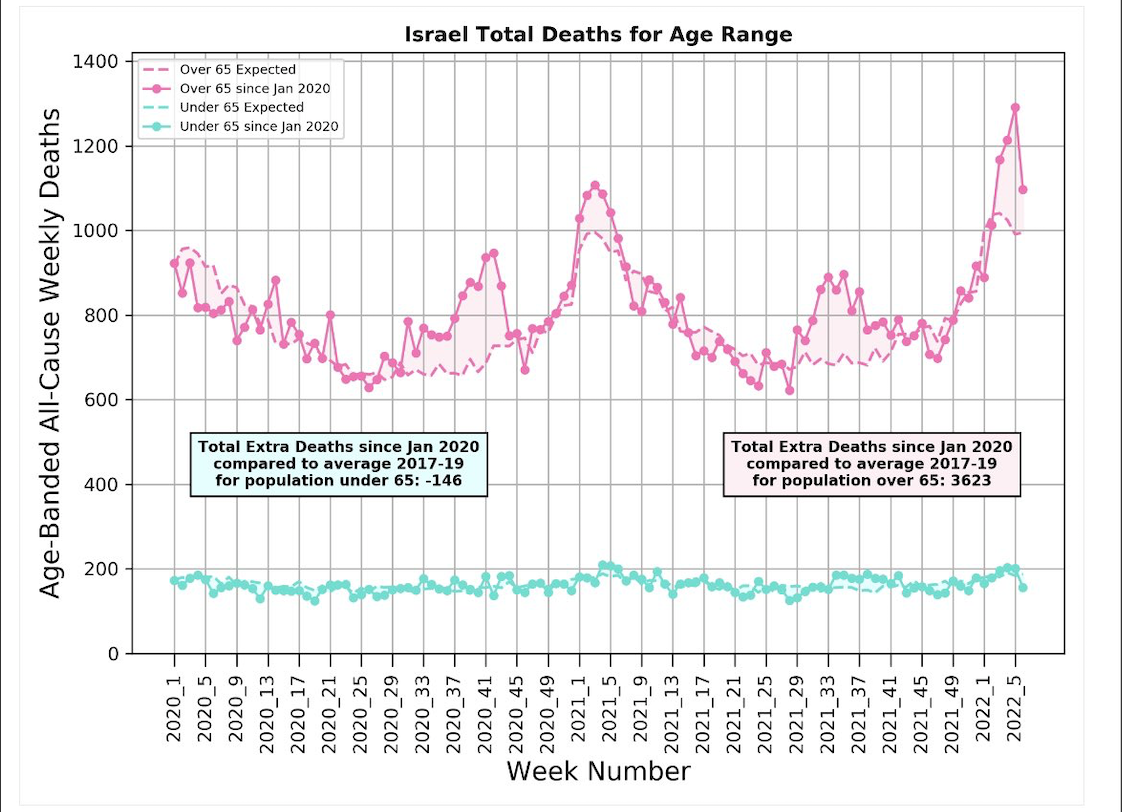
Israel
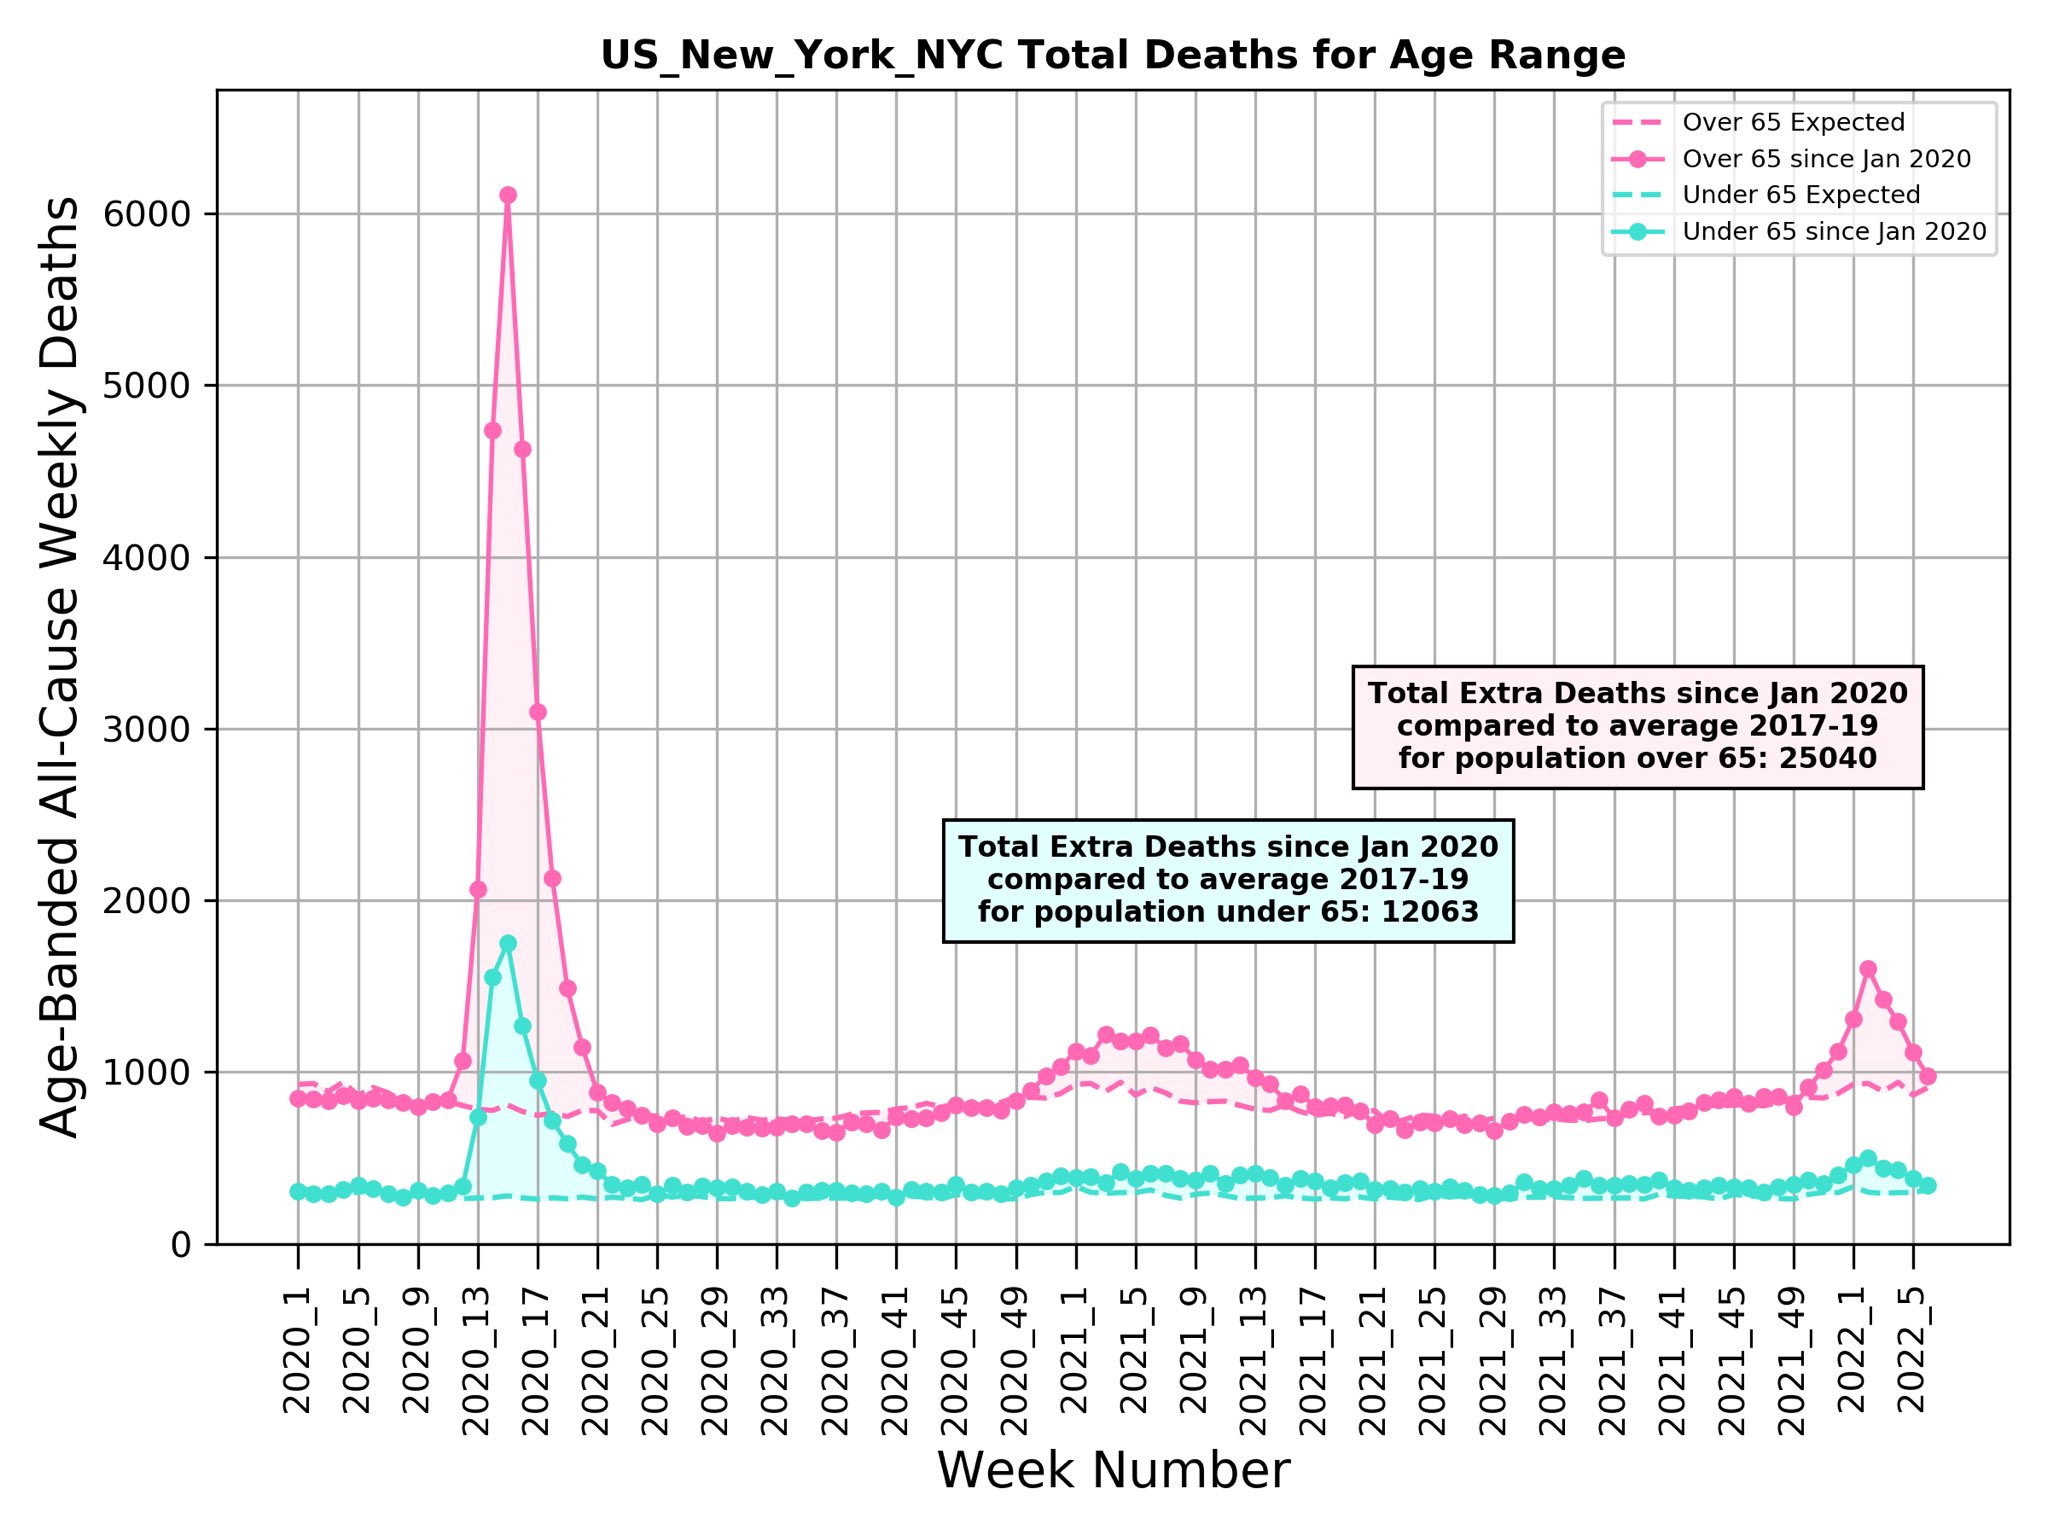
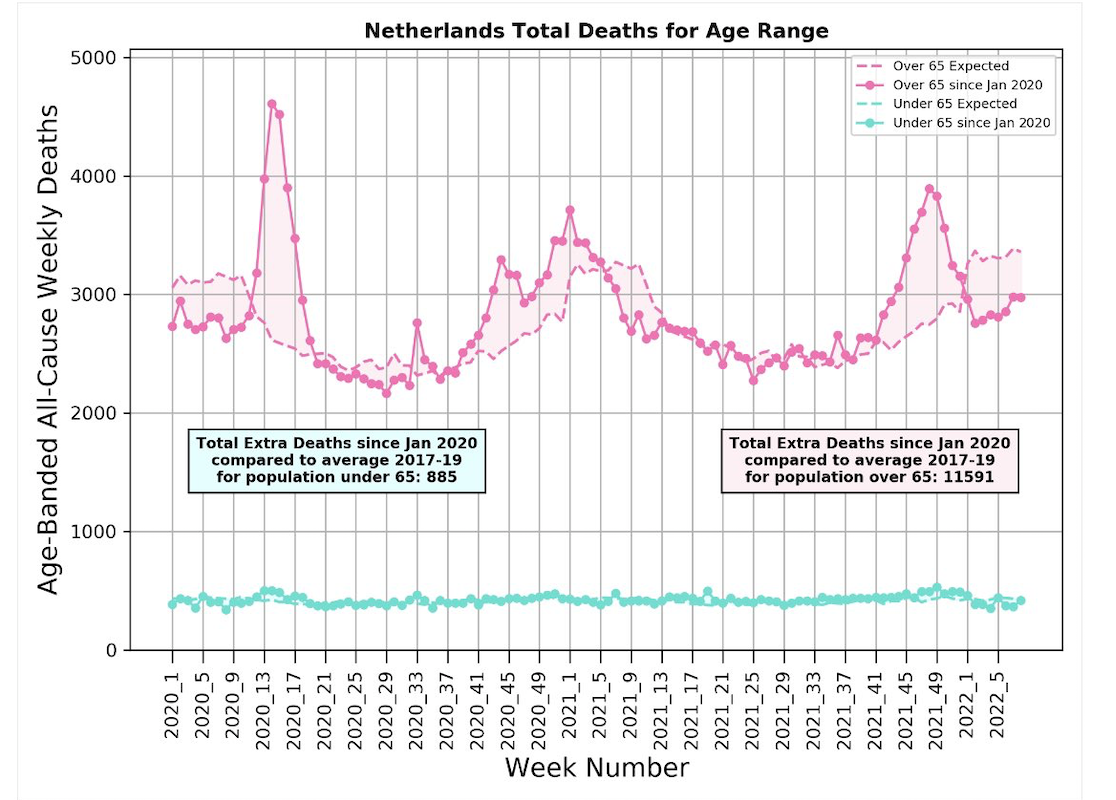
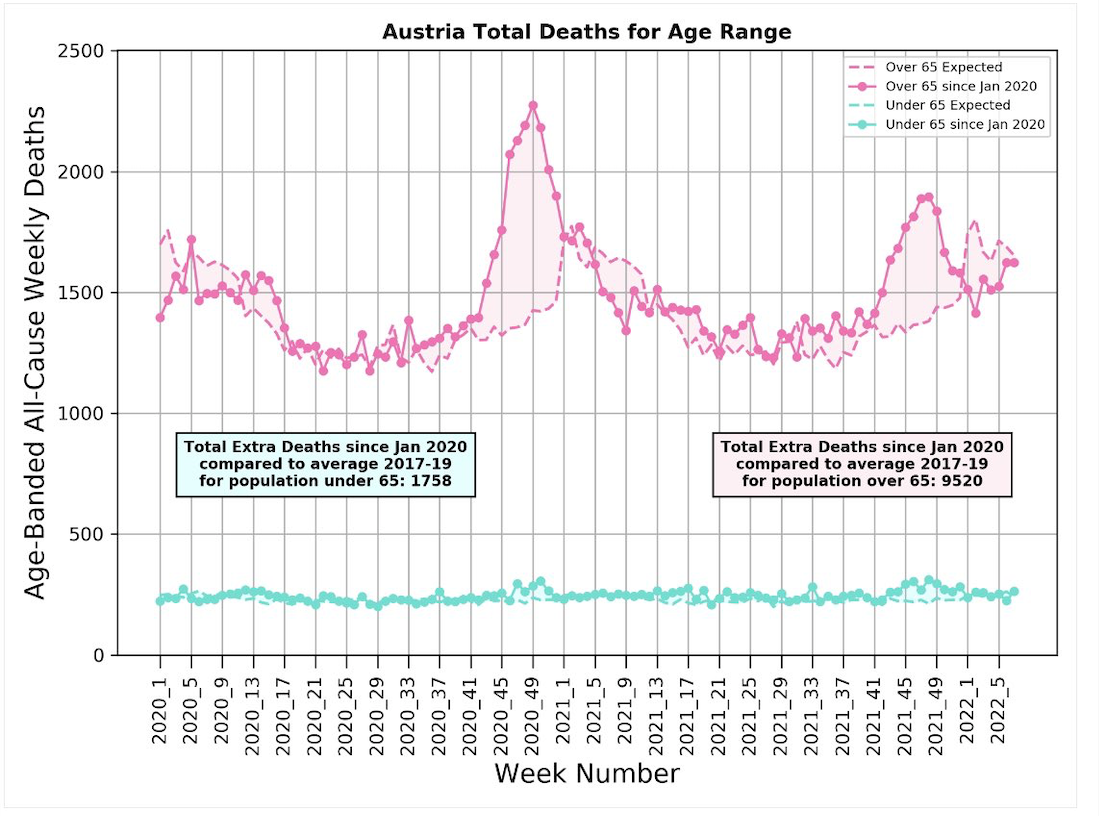
"Surprising is significant excess death in over 65-age group during supposedly mild Omicron wave in Israel, Netherlands, NYC & Austria but not in France, Denmark England & Portugal. All locations well-vaccinated by the end of 2021. What is the difference between them?"
NOTE: excess over 65 = 3623 ; under 65 = -146 ; Total excess = 3477
Week 6 2022 (13 February)
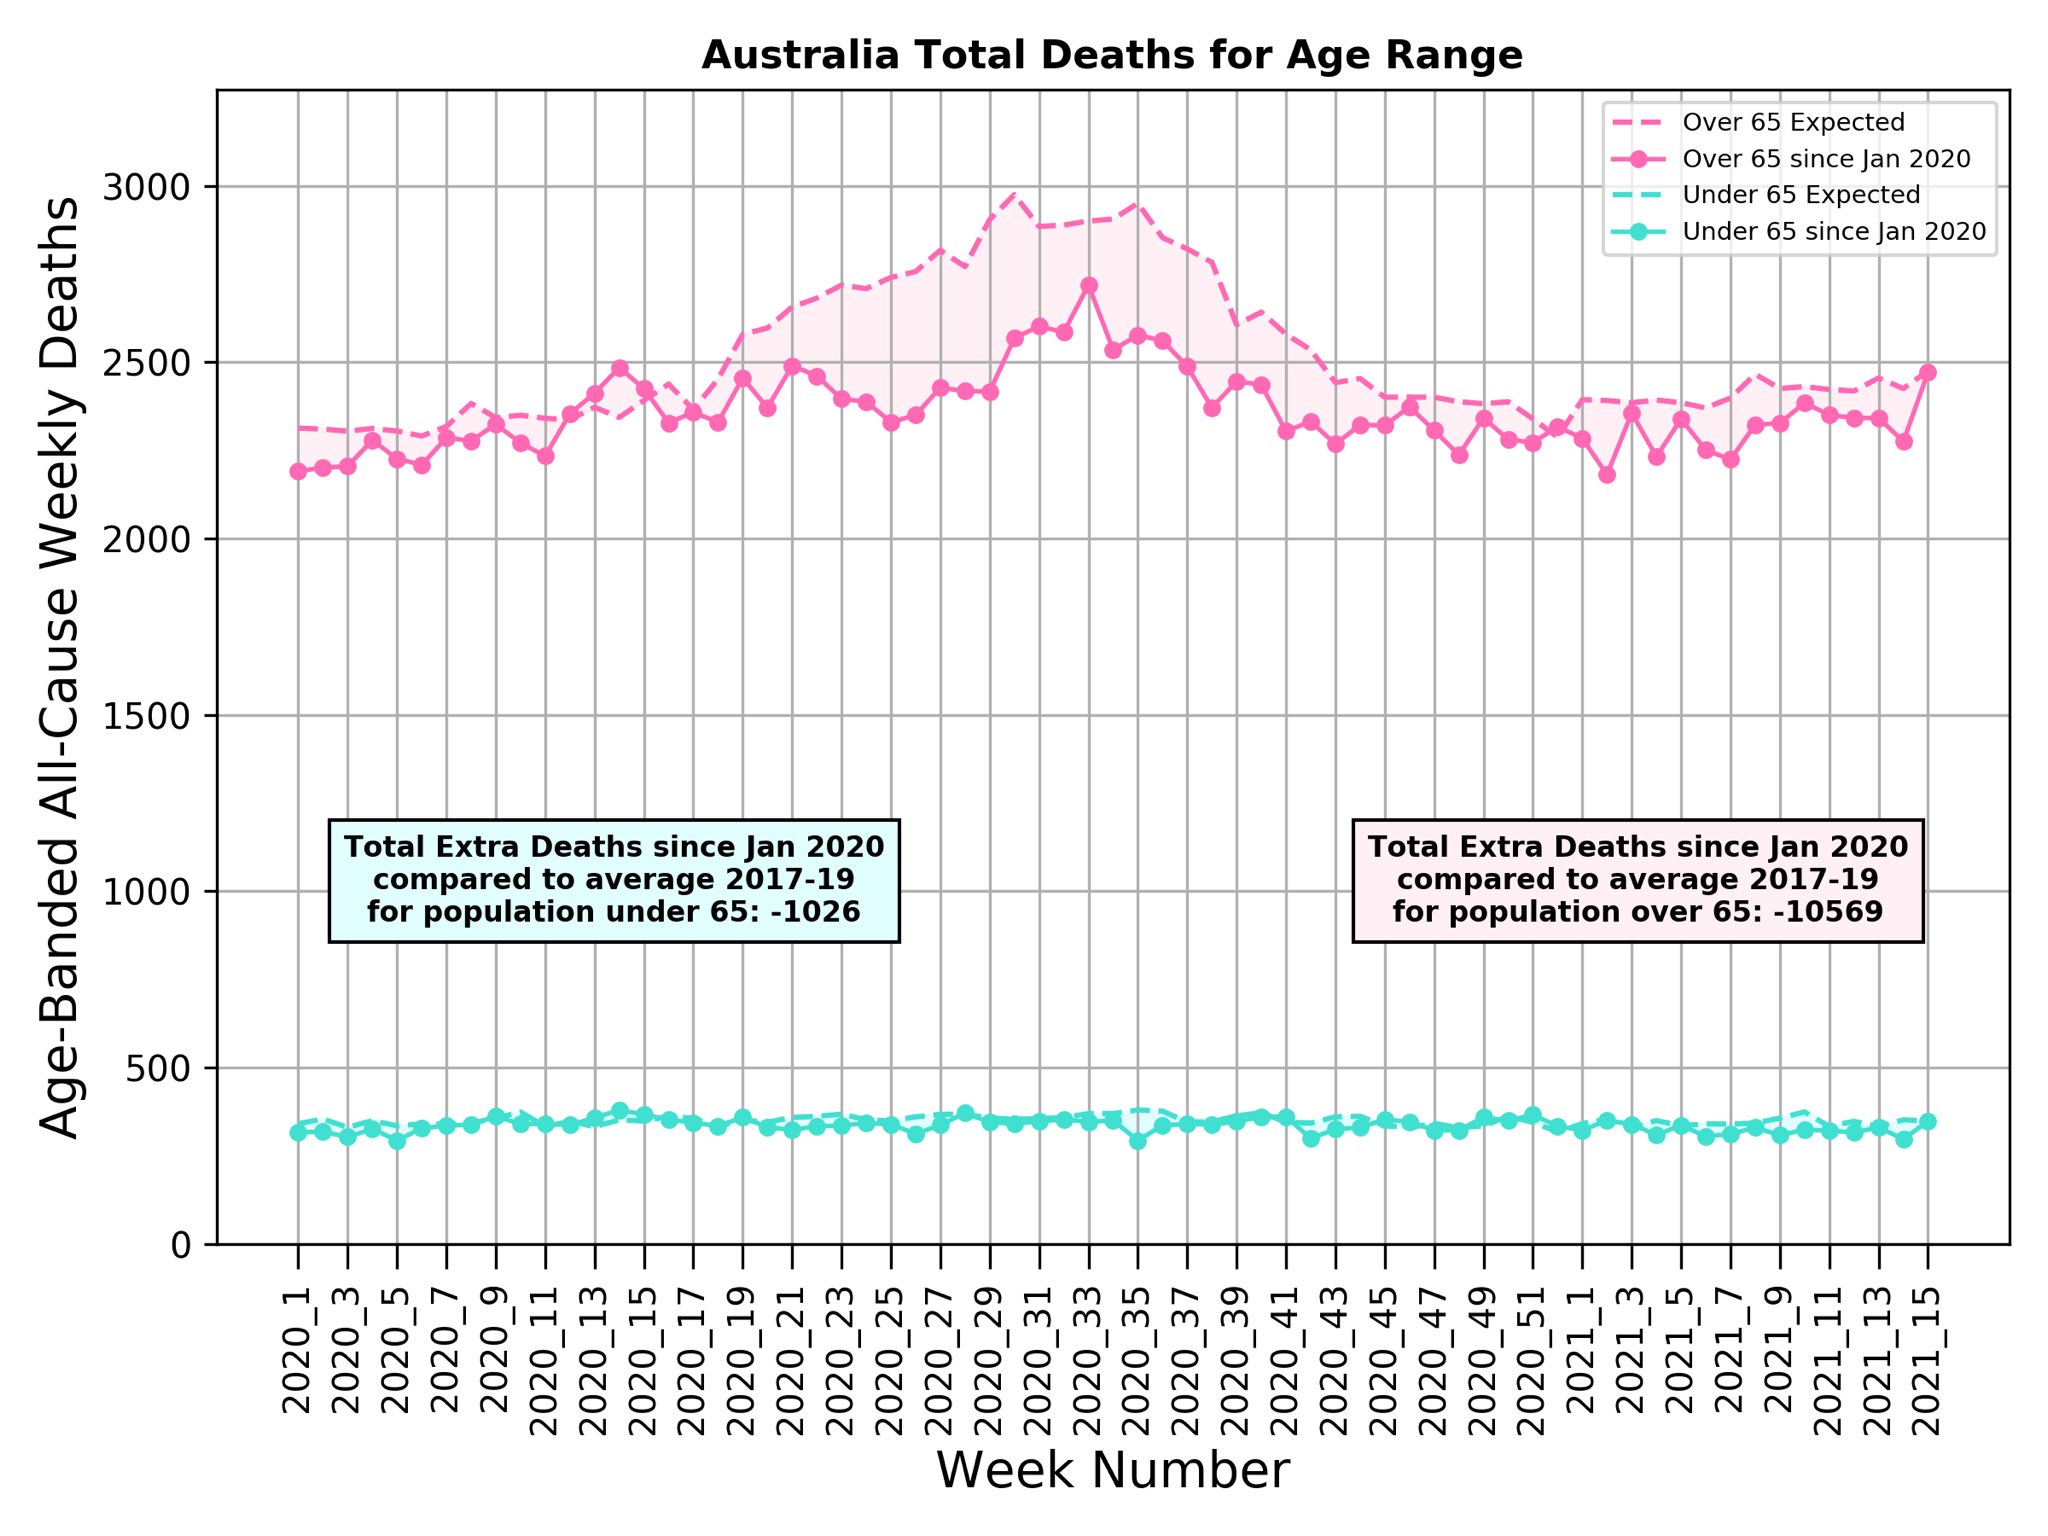
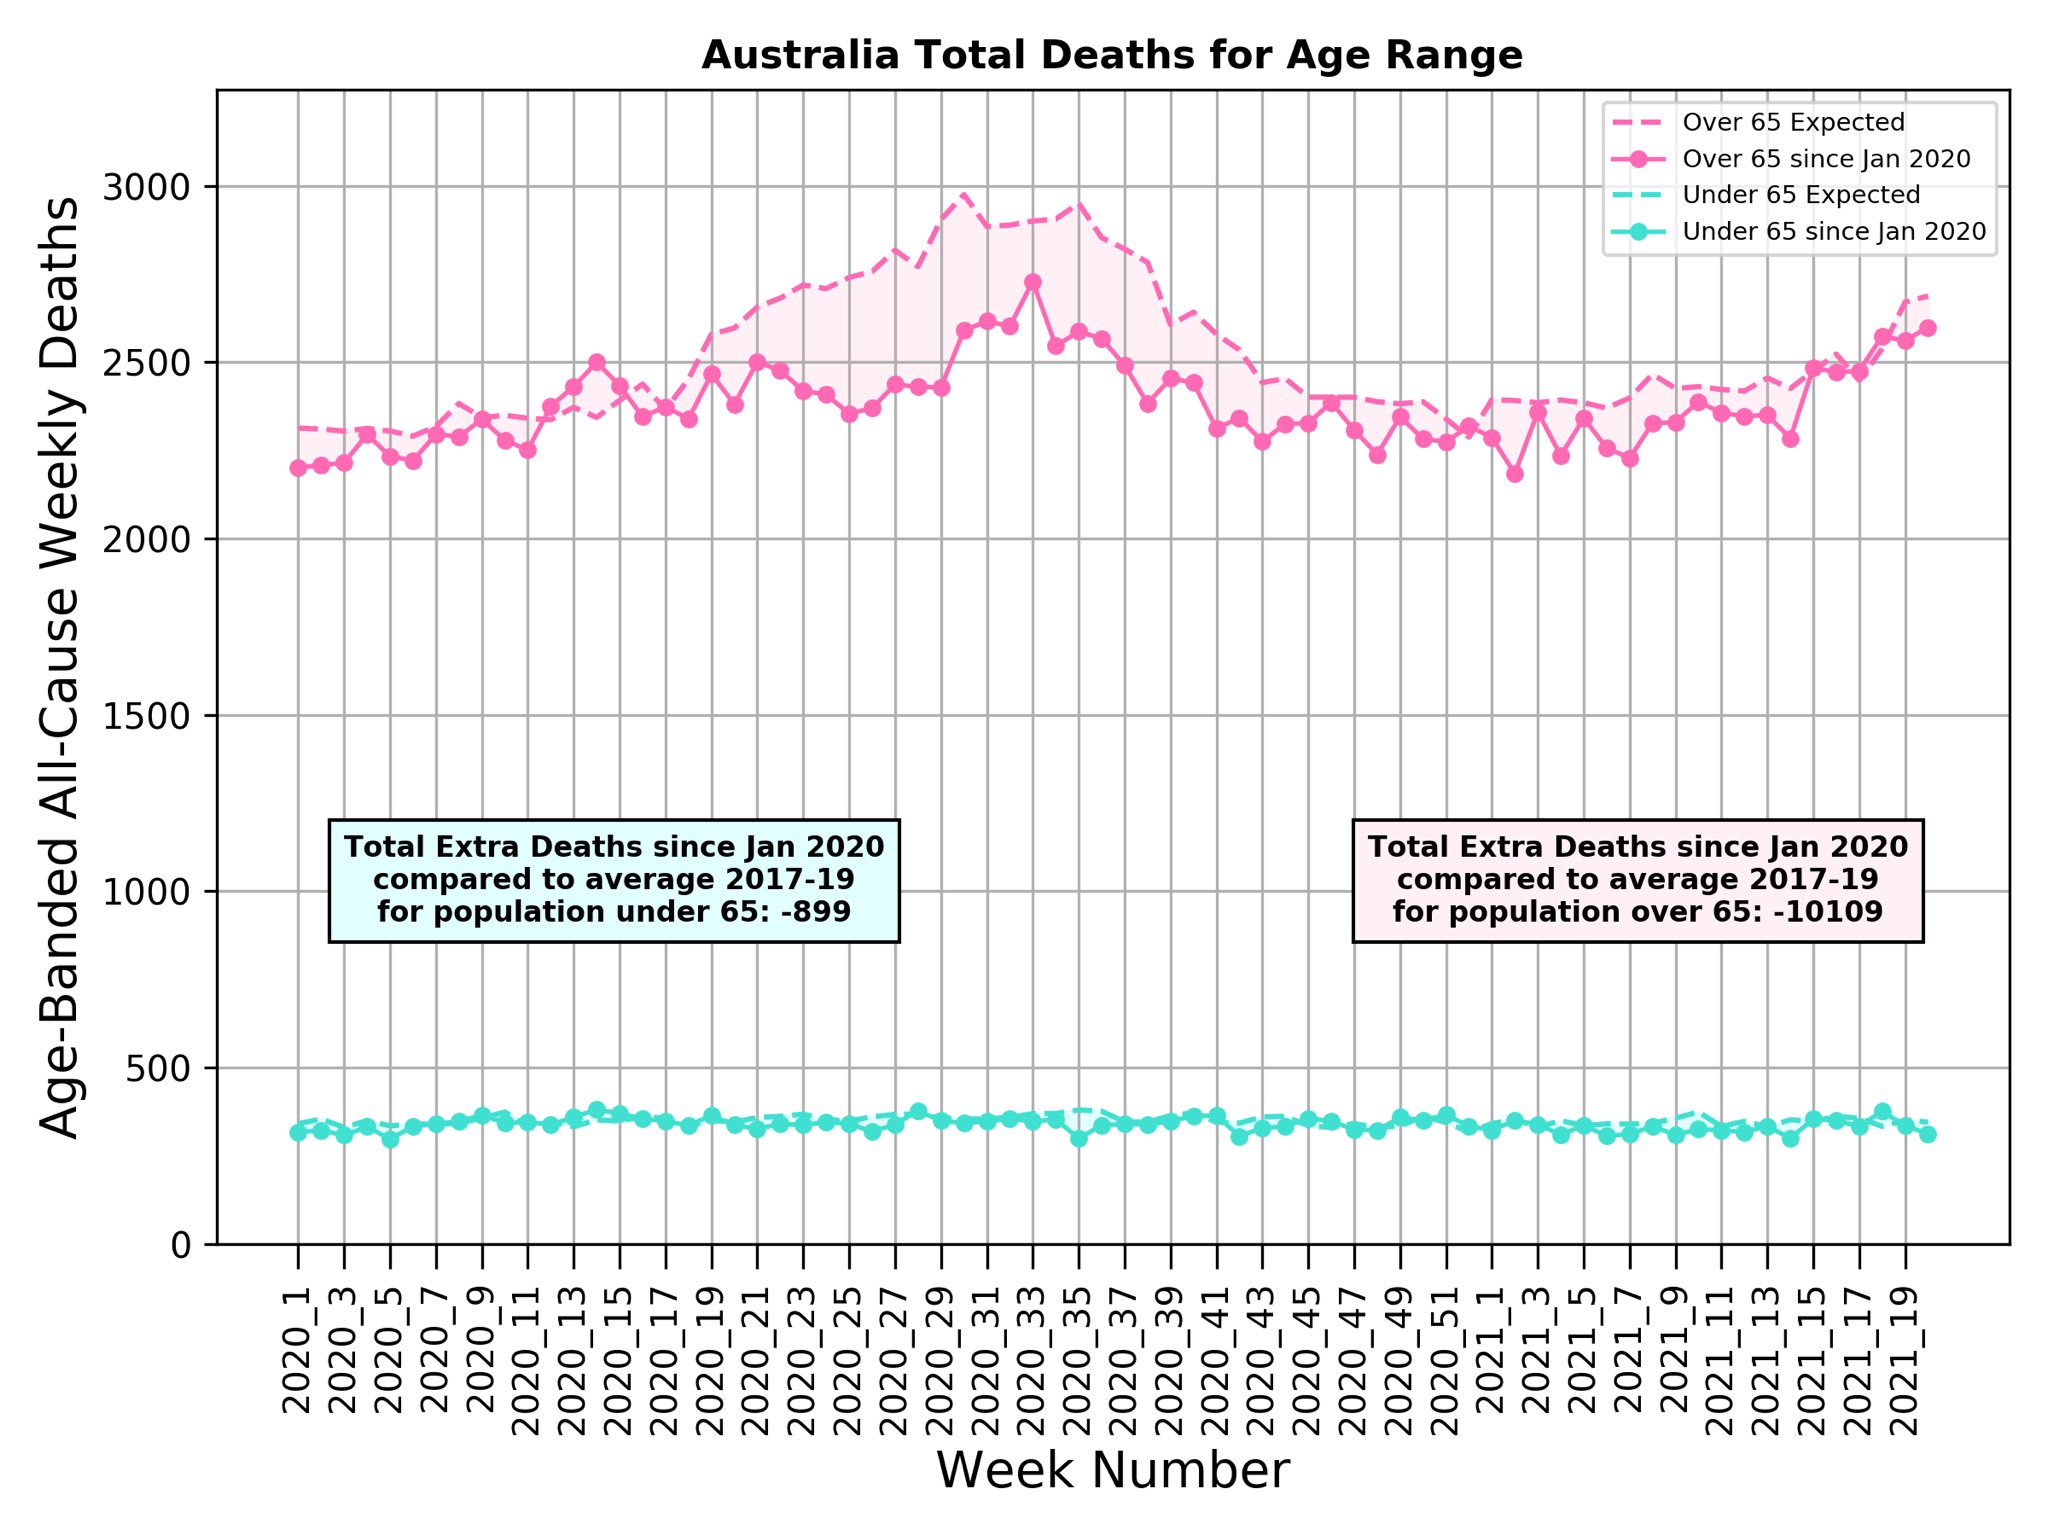
Australia
27 Aug 2021:
“Peter, what is your plan?
Global burden of COVID-19 death is in line with early observations
Australia in region of the world with deaths & cases at 2% of Europe & America (link)
All-cause AUS death 6% below expected: excess is -11,000”
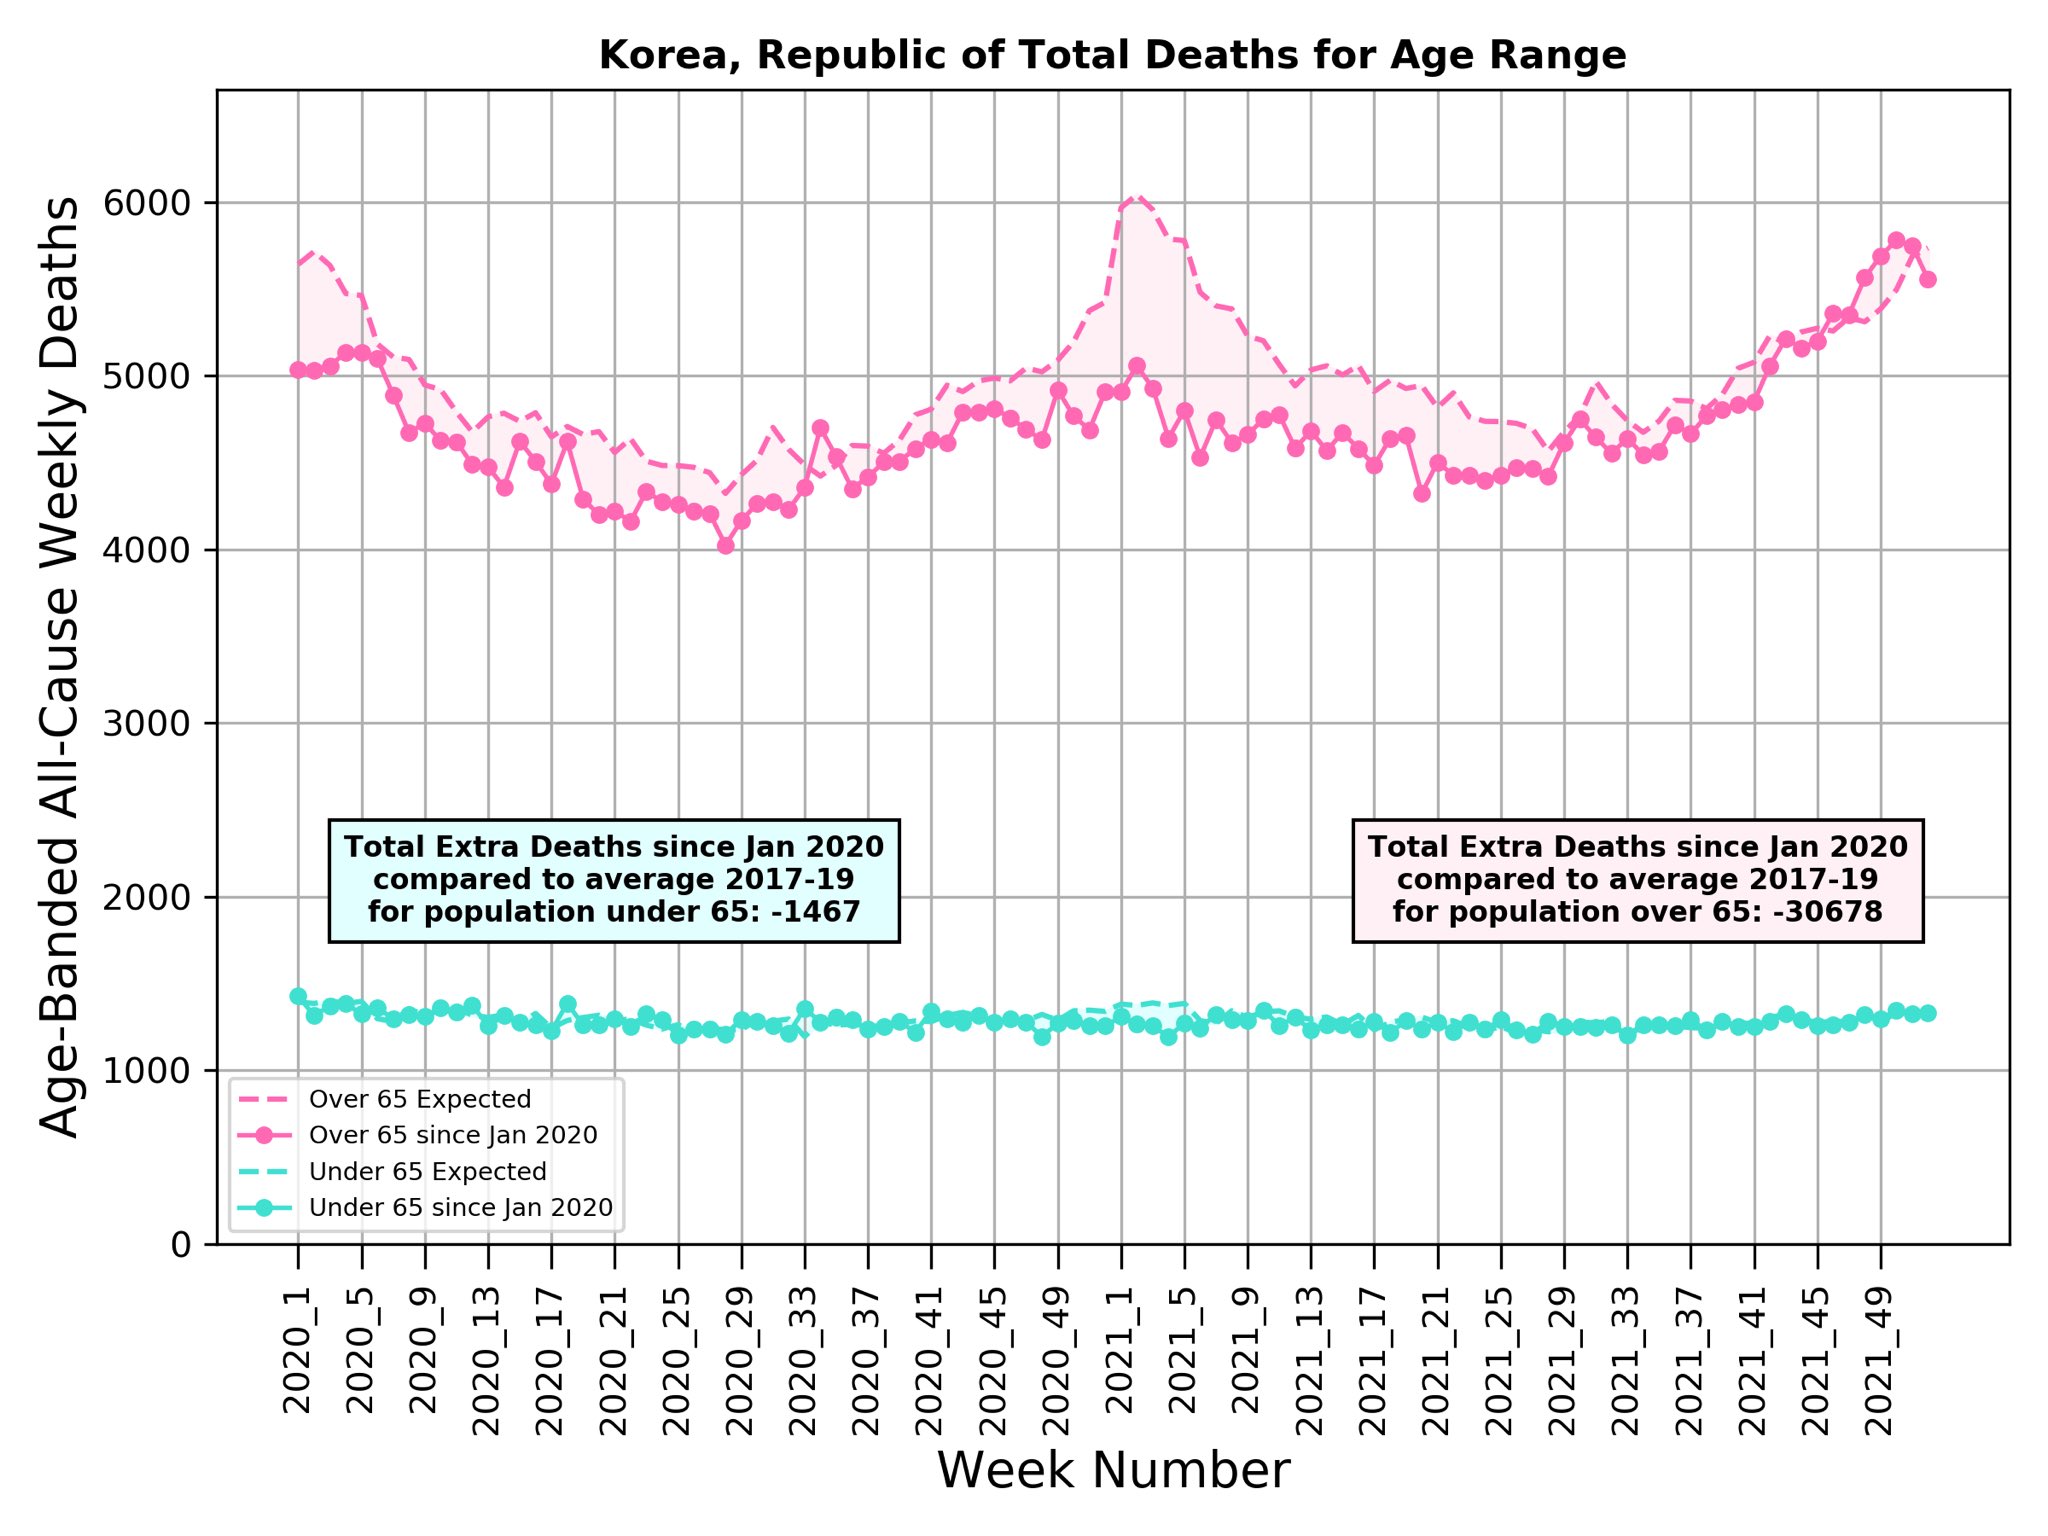
"South Korea outbreak is Gompertz with ln(Exponential Growth Rate) dropping linearly with time. Total cases & deaths are 25,000,000 & 25,000 (CFR=1000). Population 52M so 50% infected. Aiming for natural immunity? Deaths fill deficit of 32,000.”
Google sheet for Gompertz graph of most recent outbreak LINK
"Not easy to estimate burden of death from influenza.
1) No wide-spread testing for flu as there is for COVID.
2) Flu deaths that occur every winter are expected & so not part of excess death.
Is 5% death deficit seen when no flu or COVID indicative of real level of flu death?"
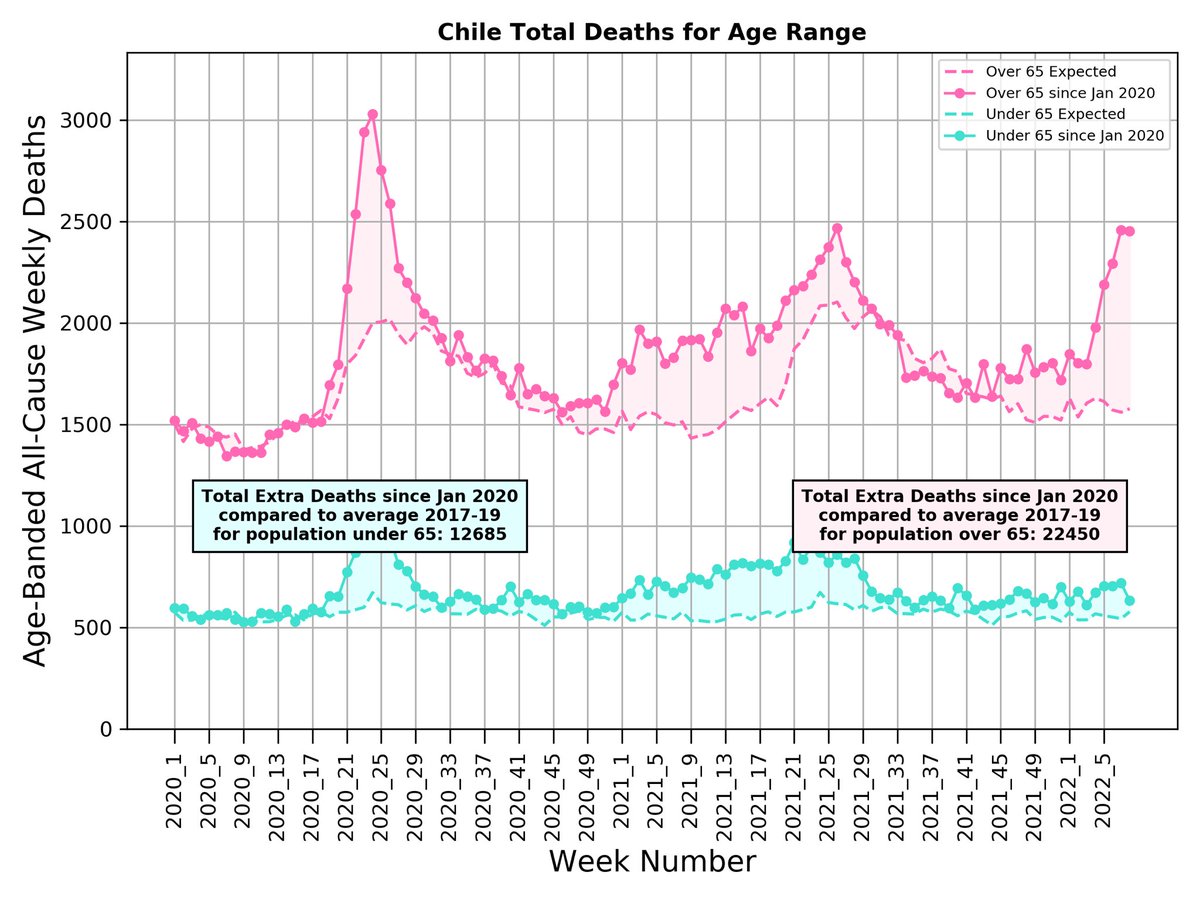
“Important observation. Chile looks worse now than ever before with excess death 65% above expected for over 65 year olds. Only good news is that the excess death for those under 65 is better than July 2021.”
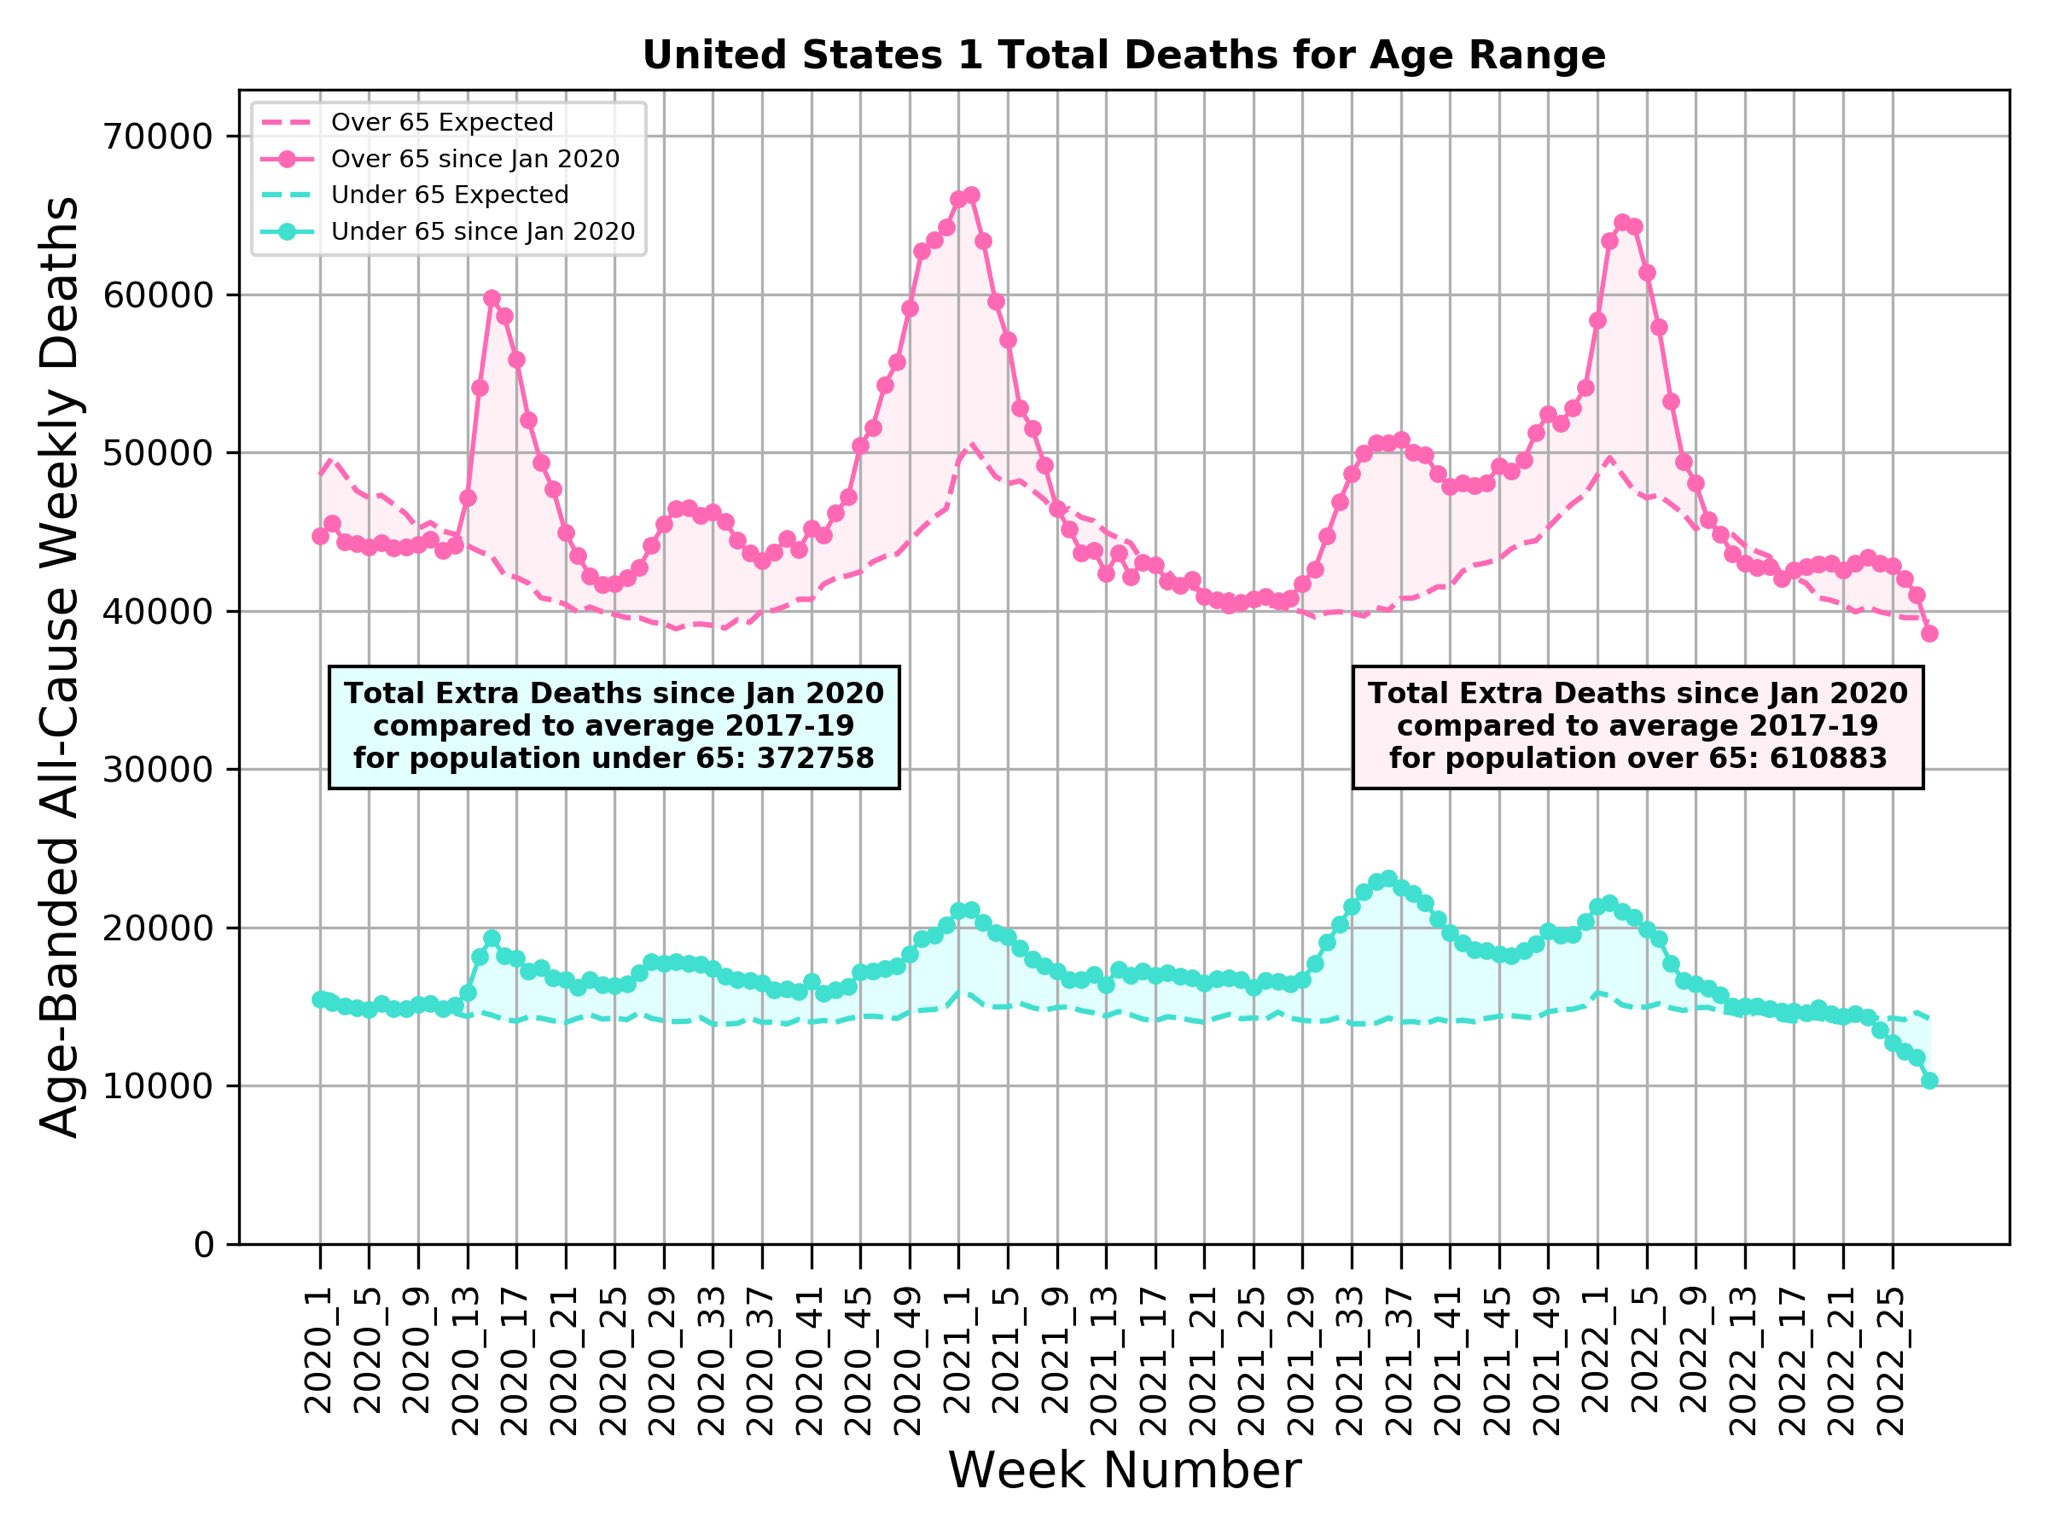
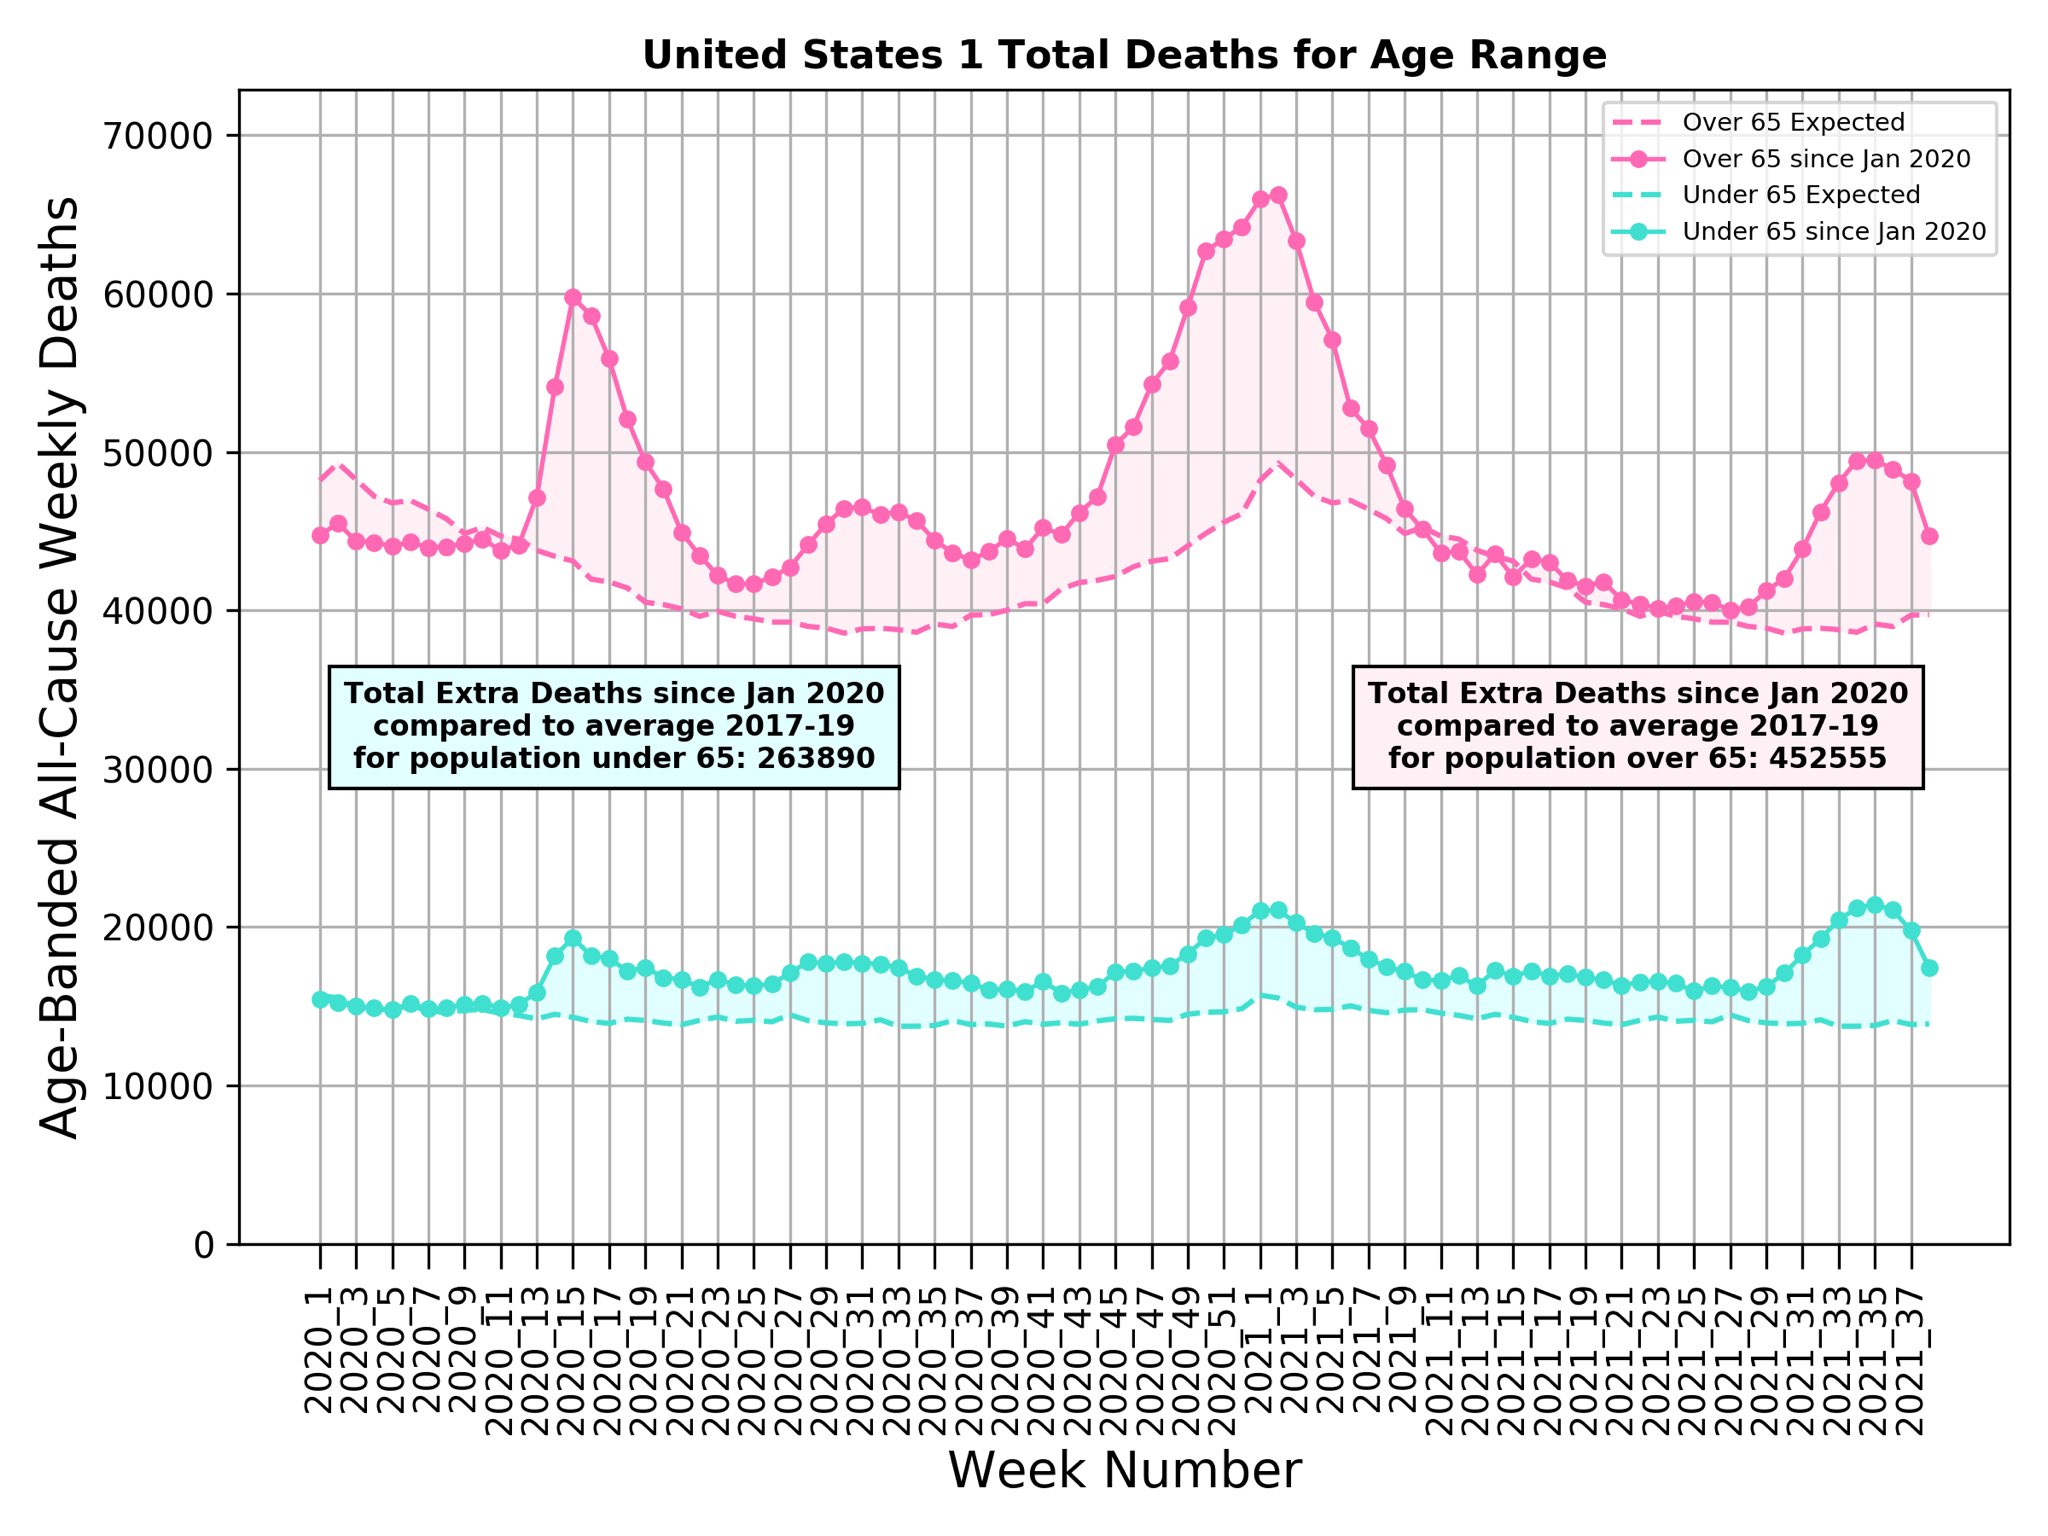
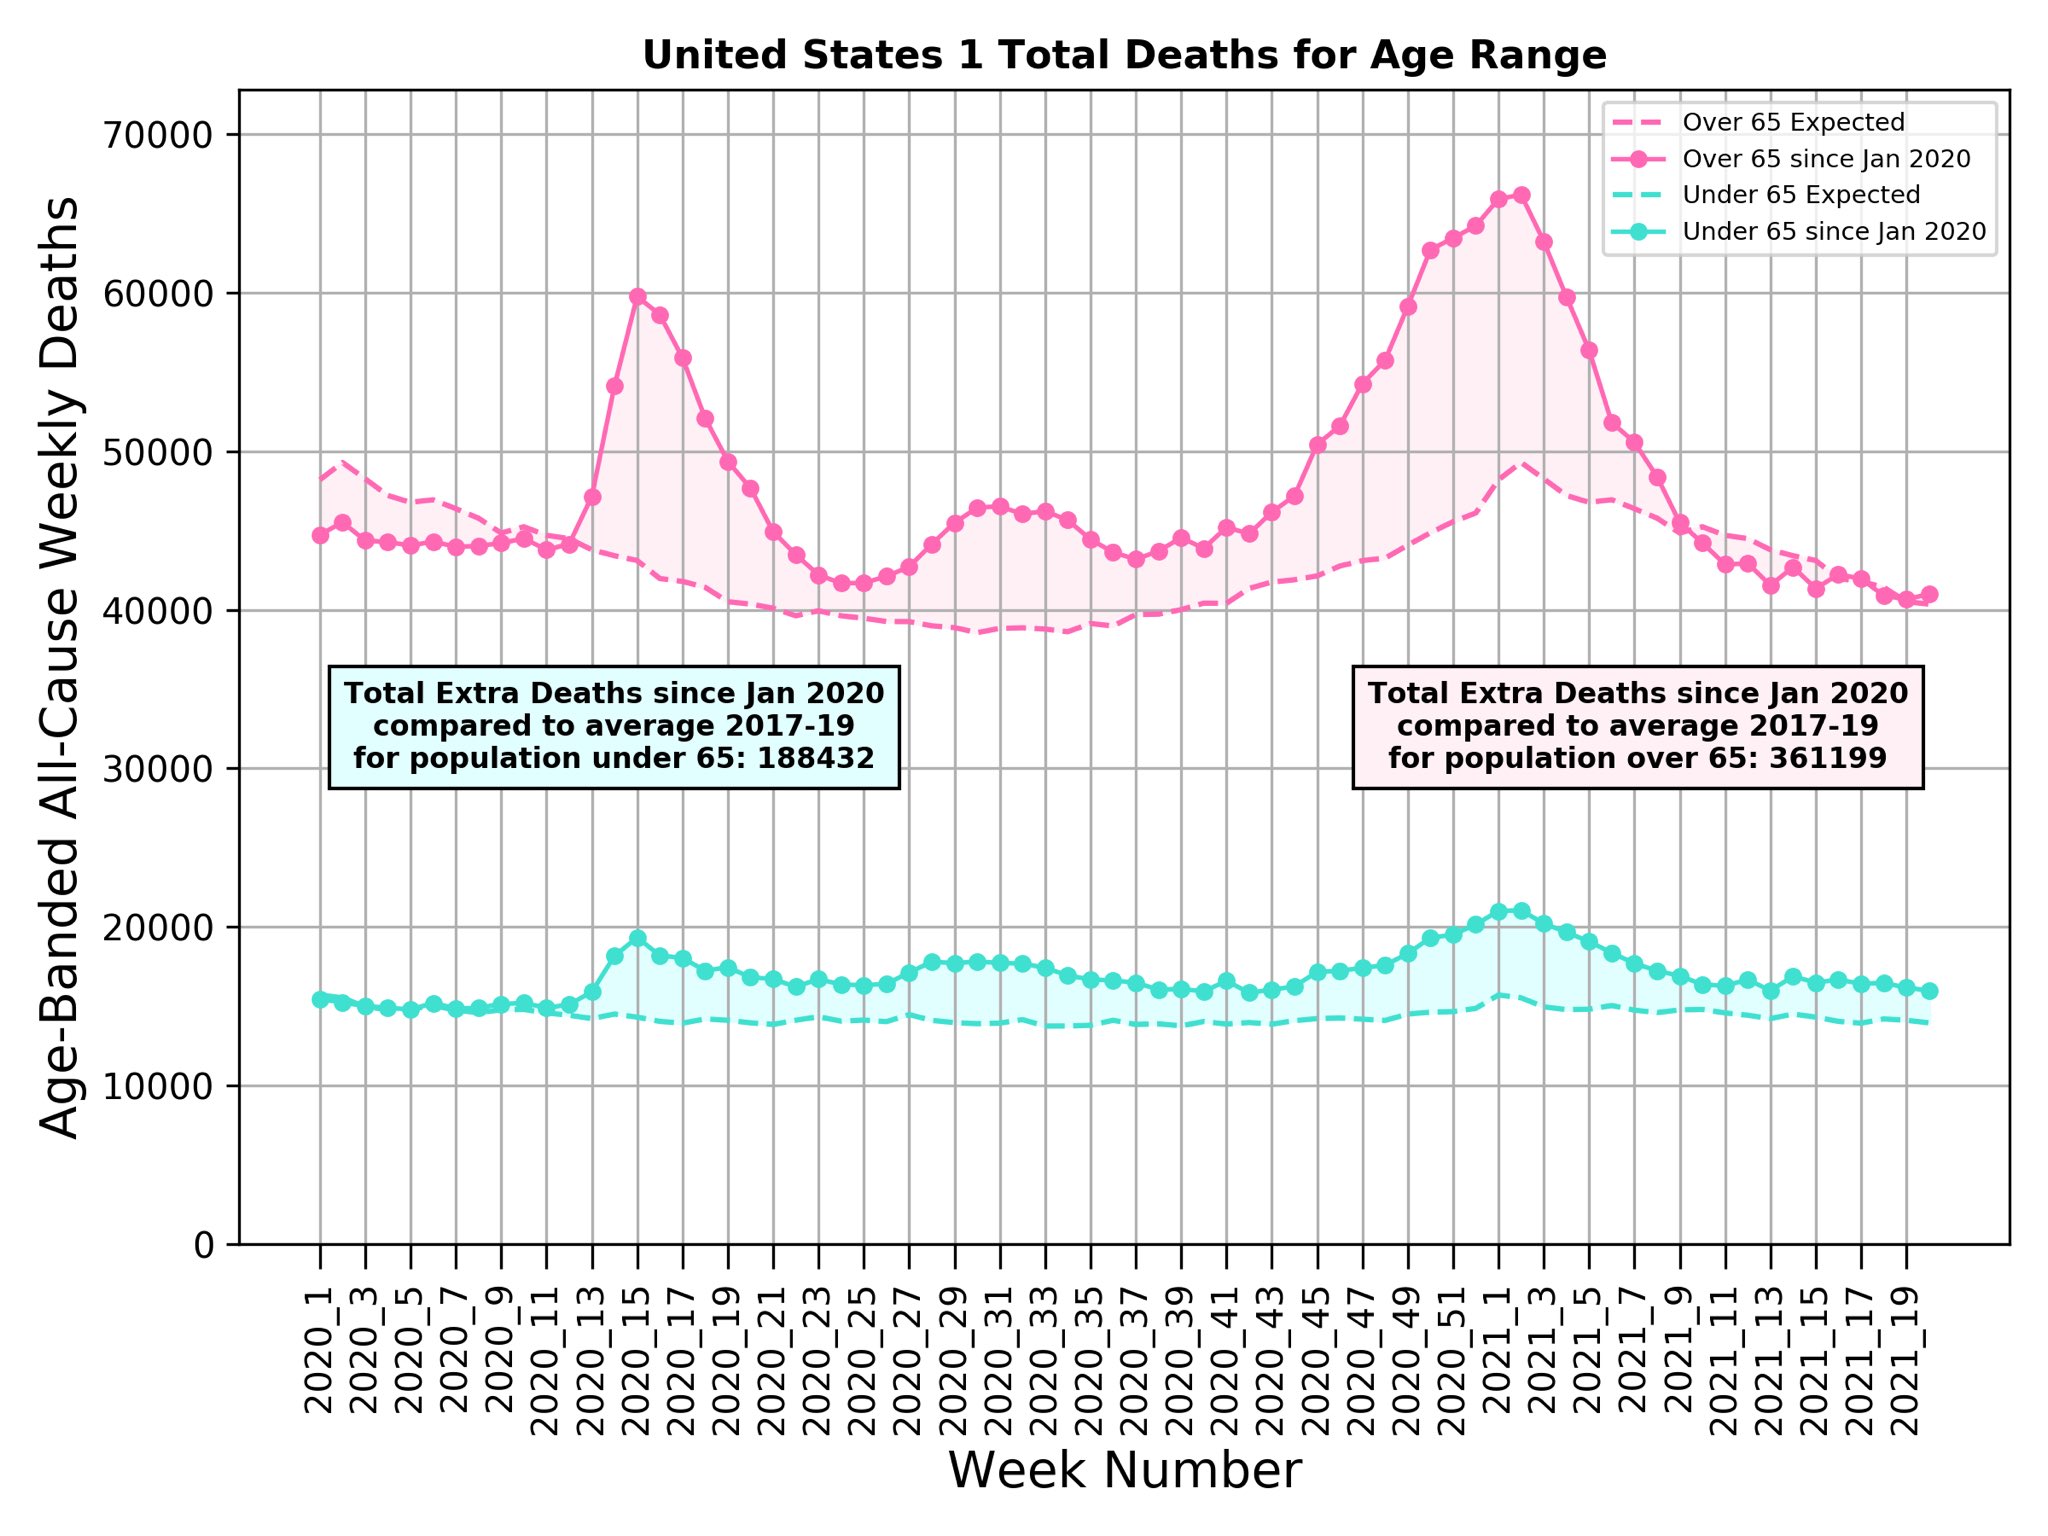
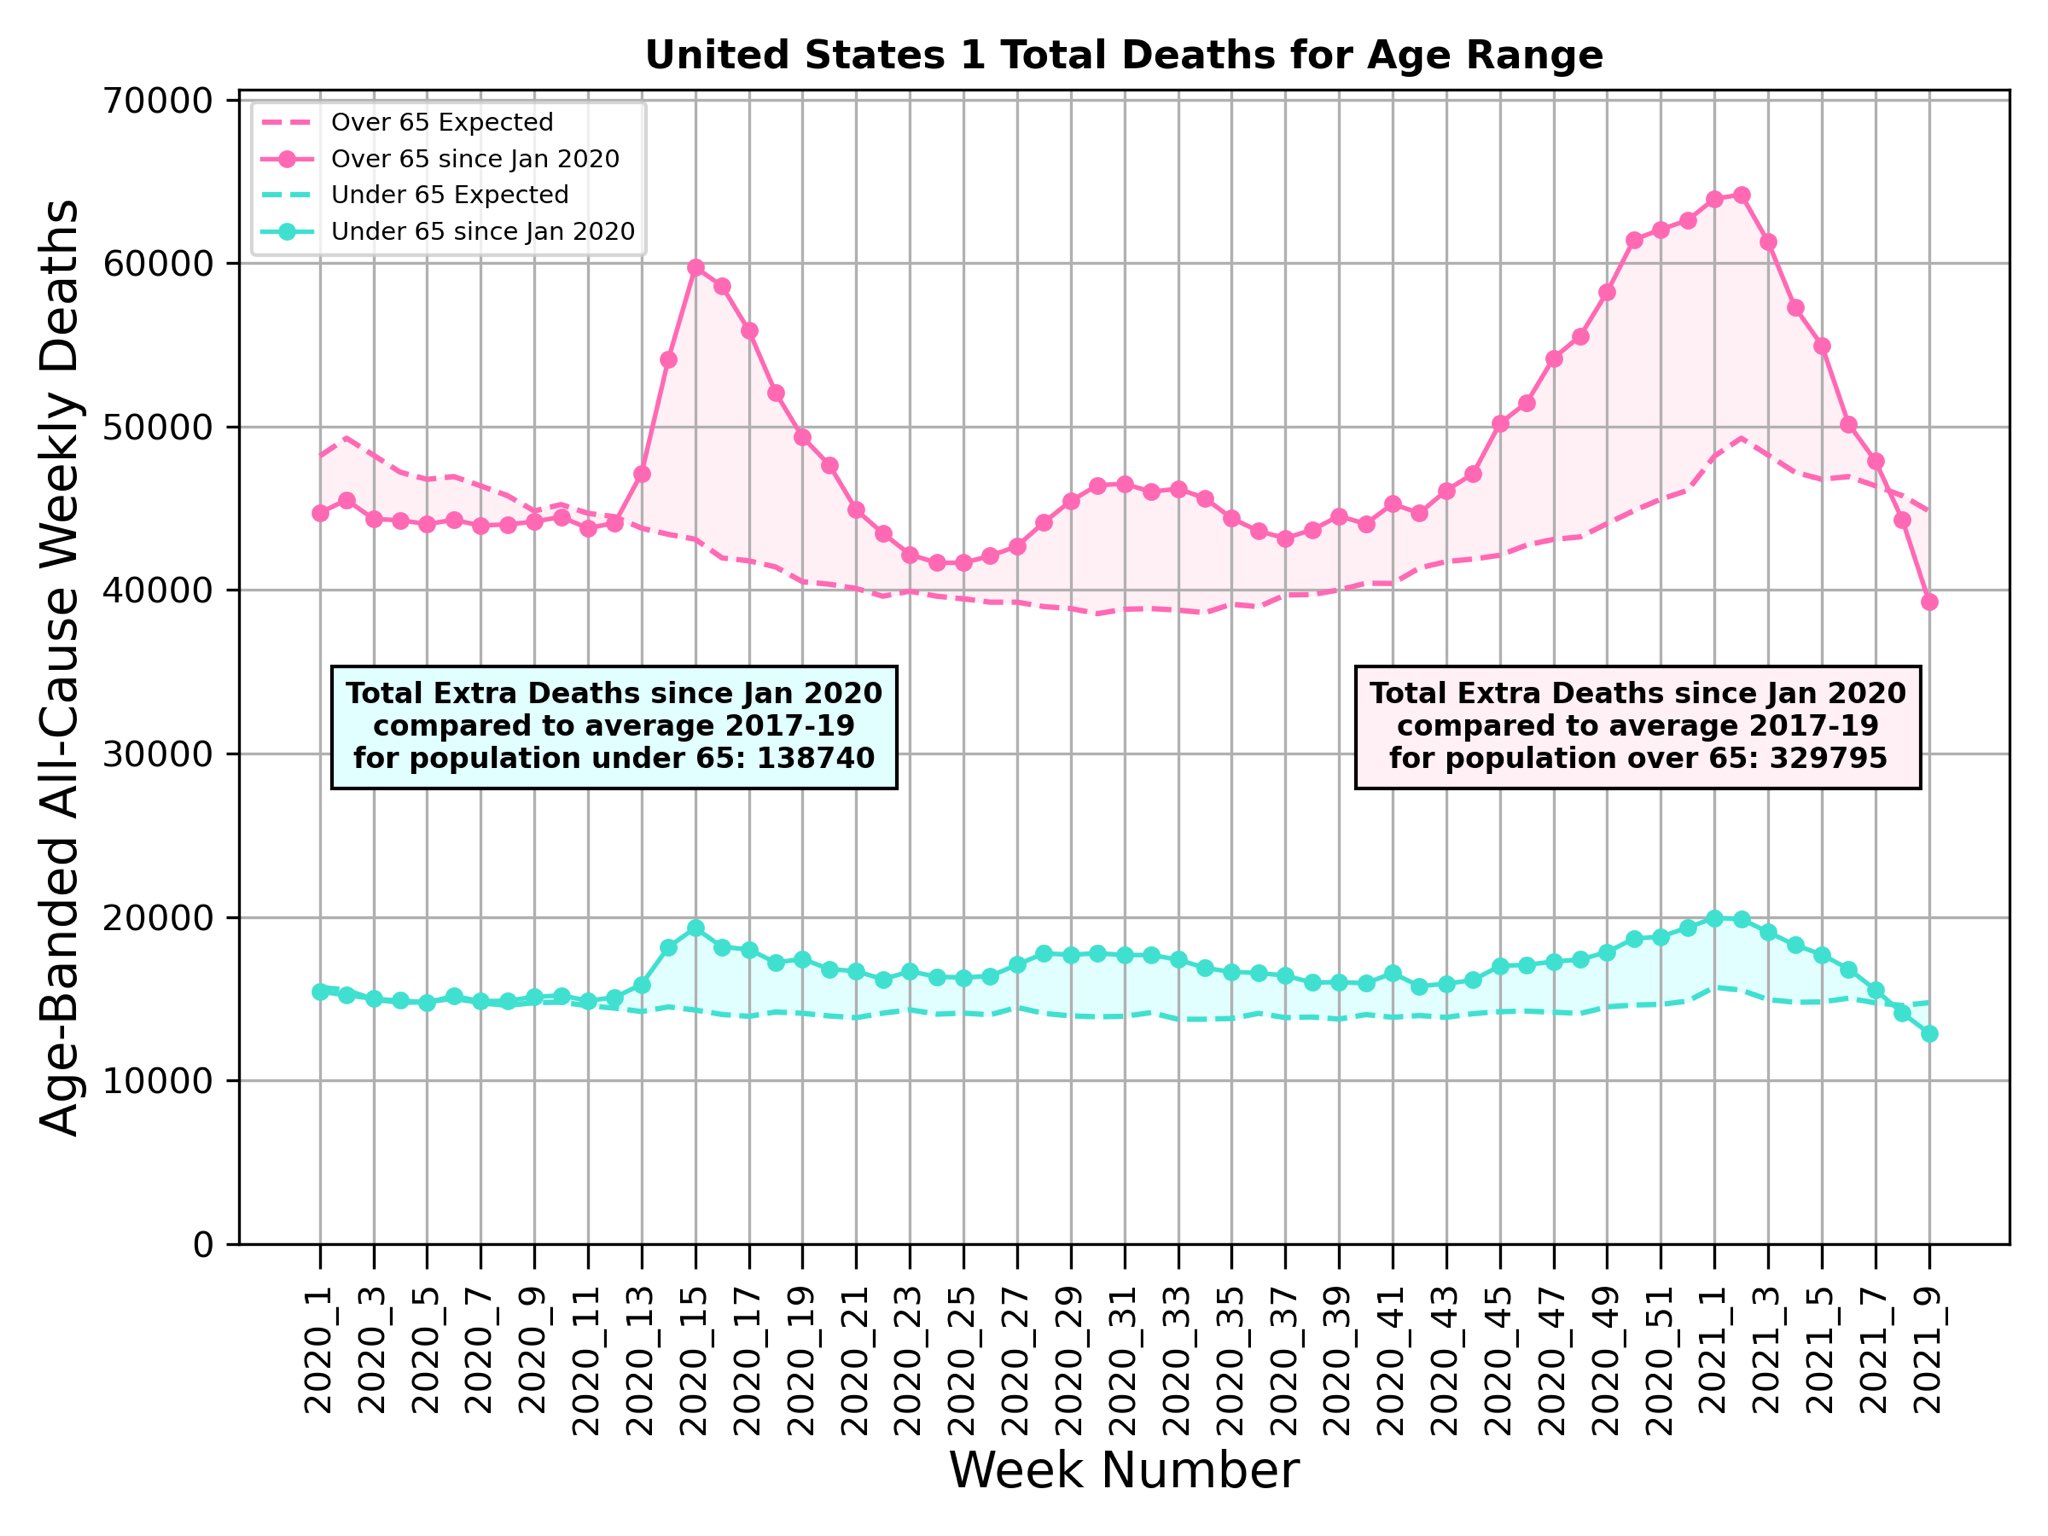
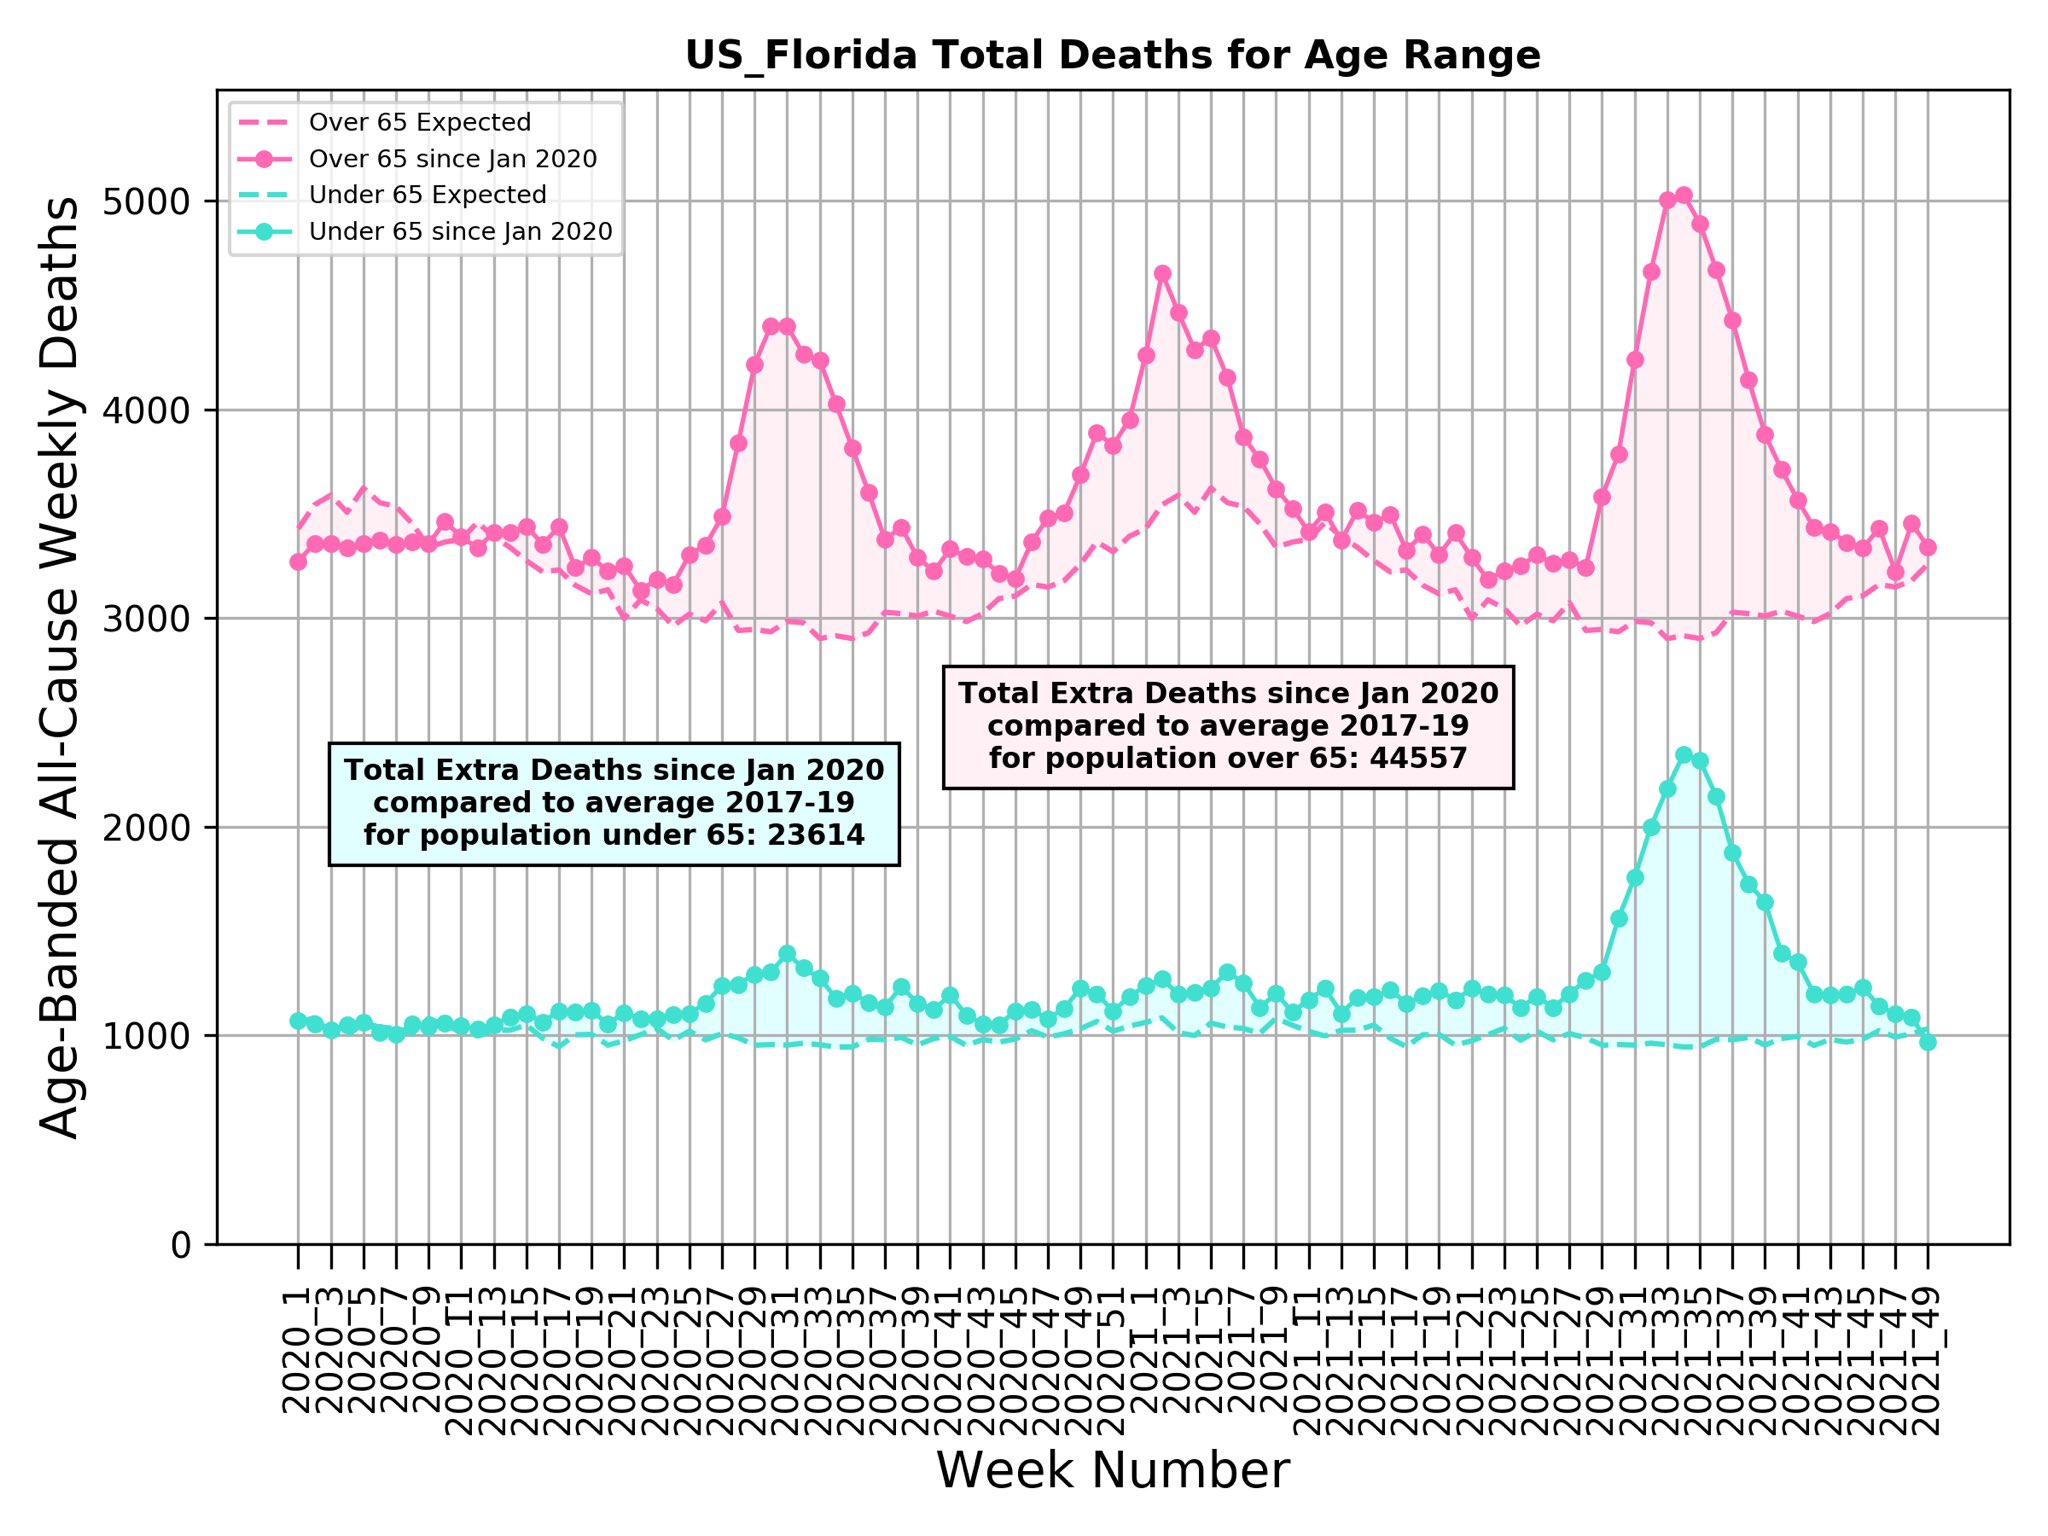
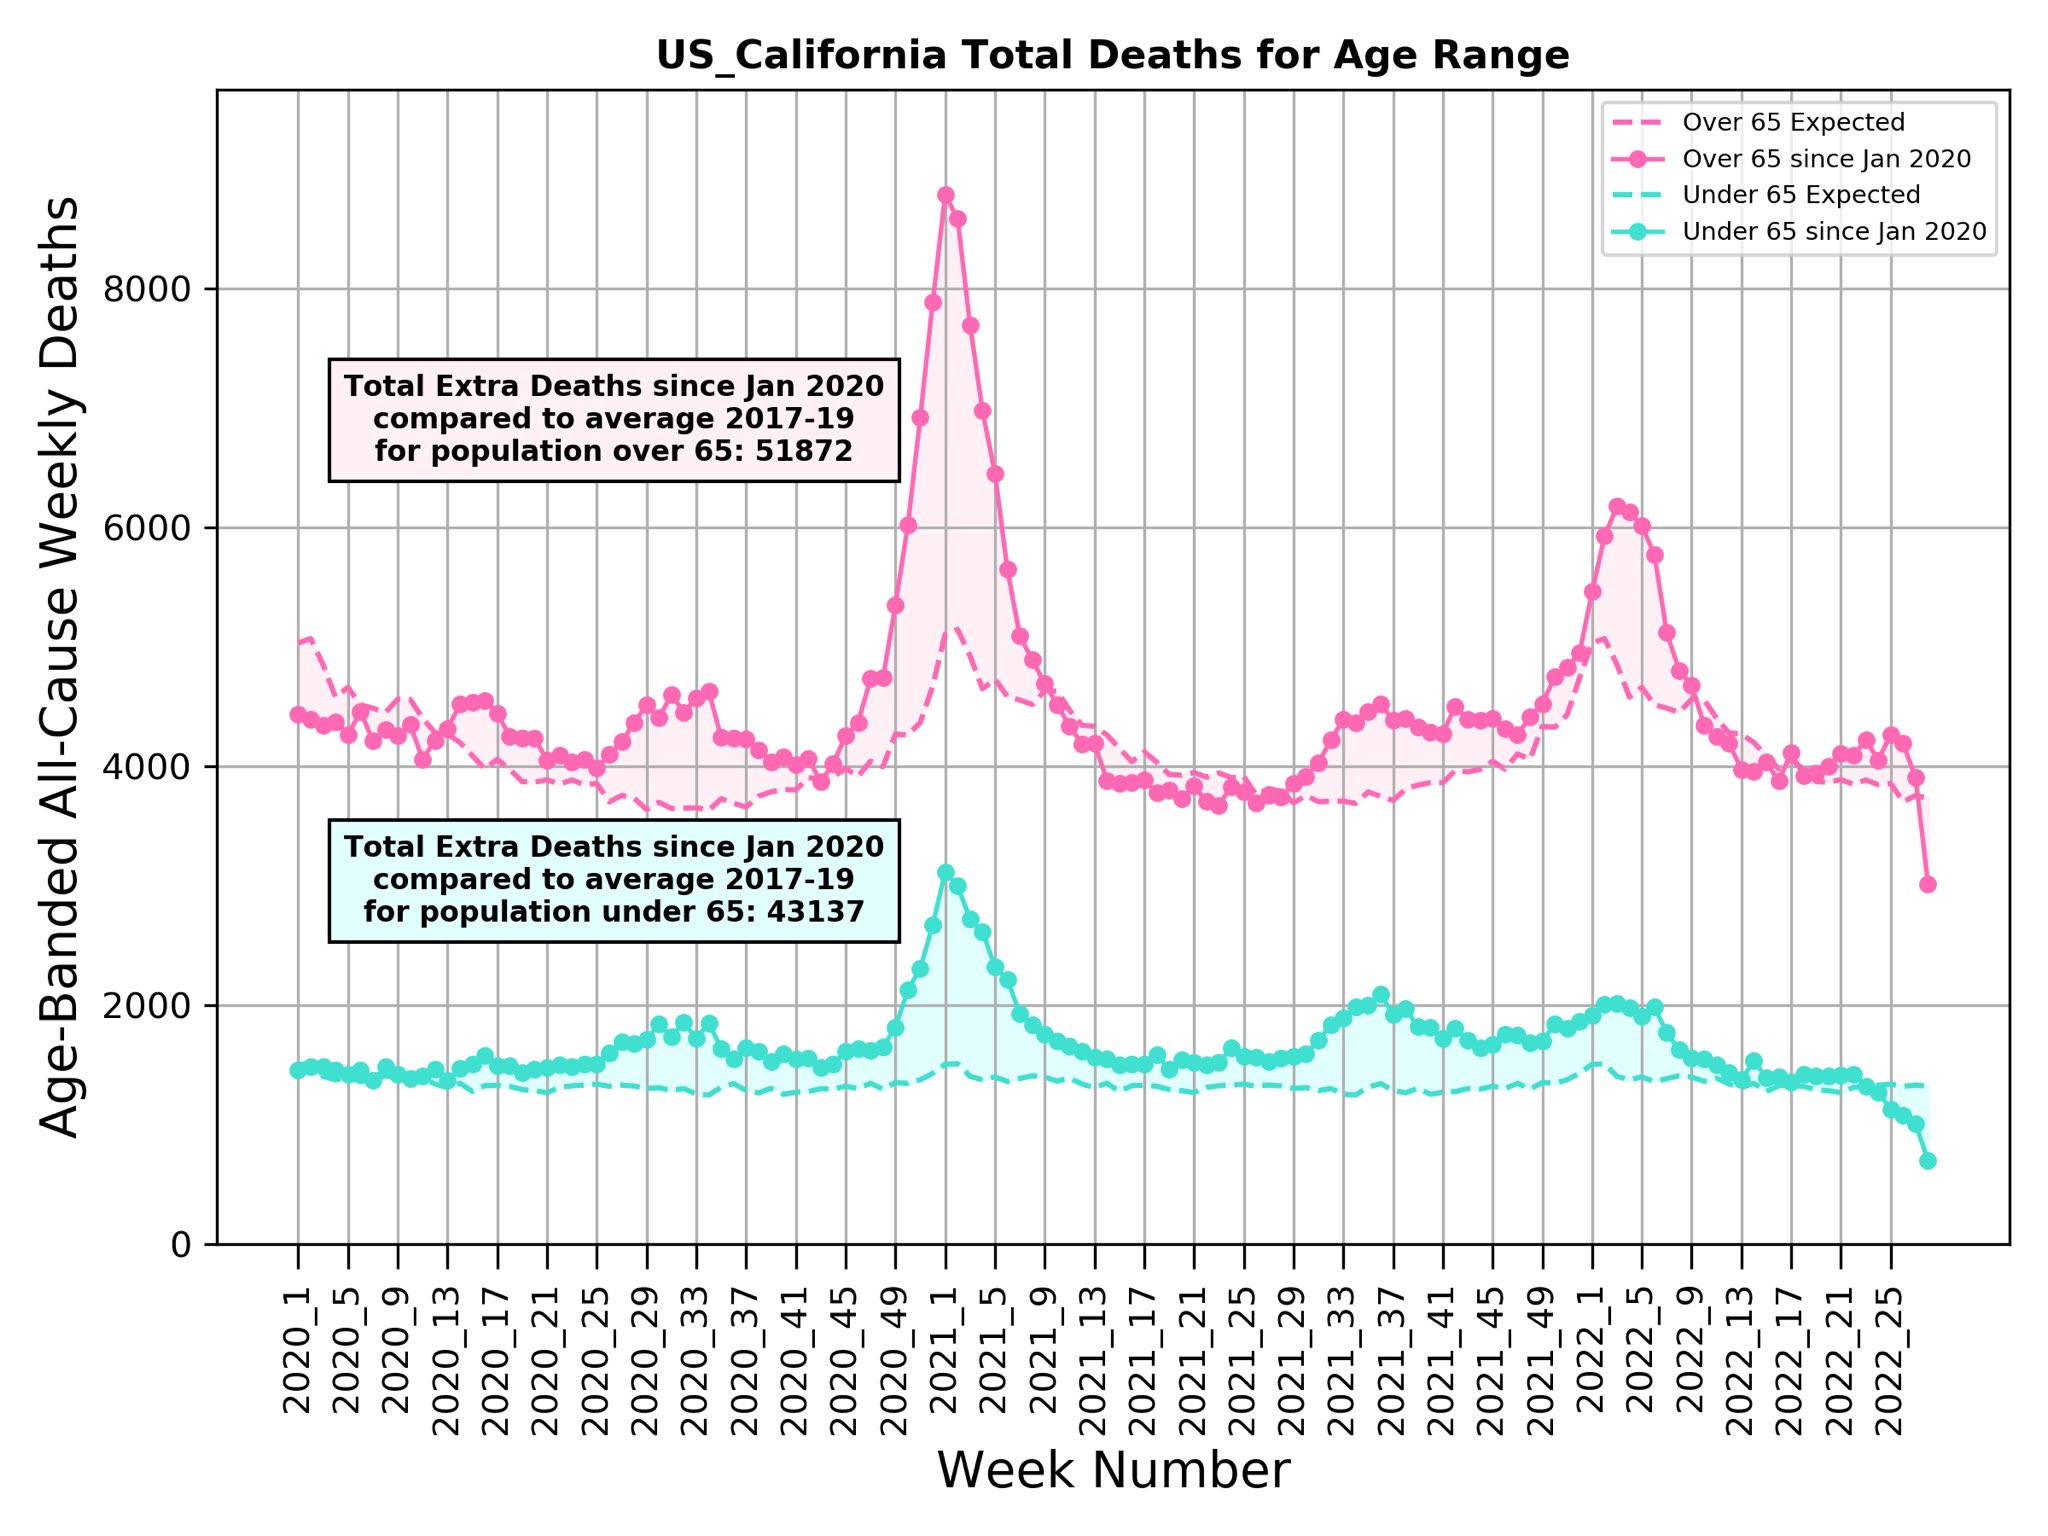
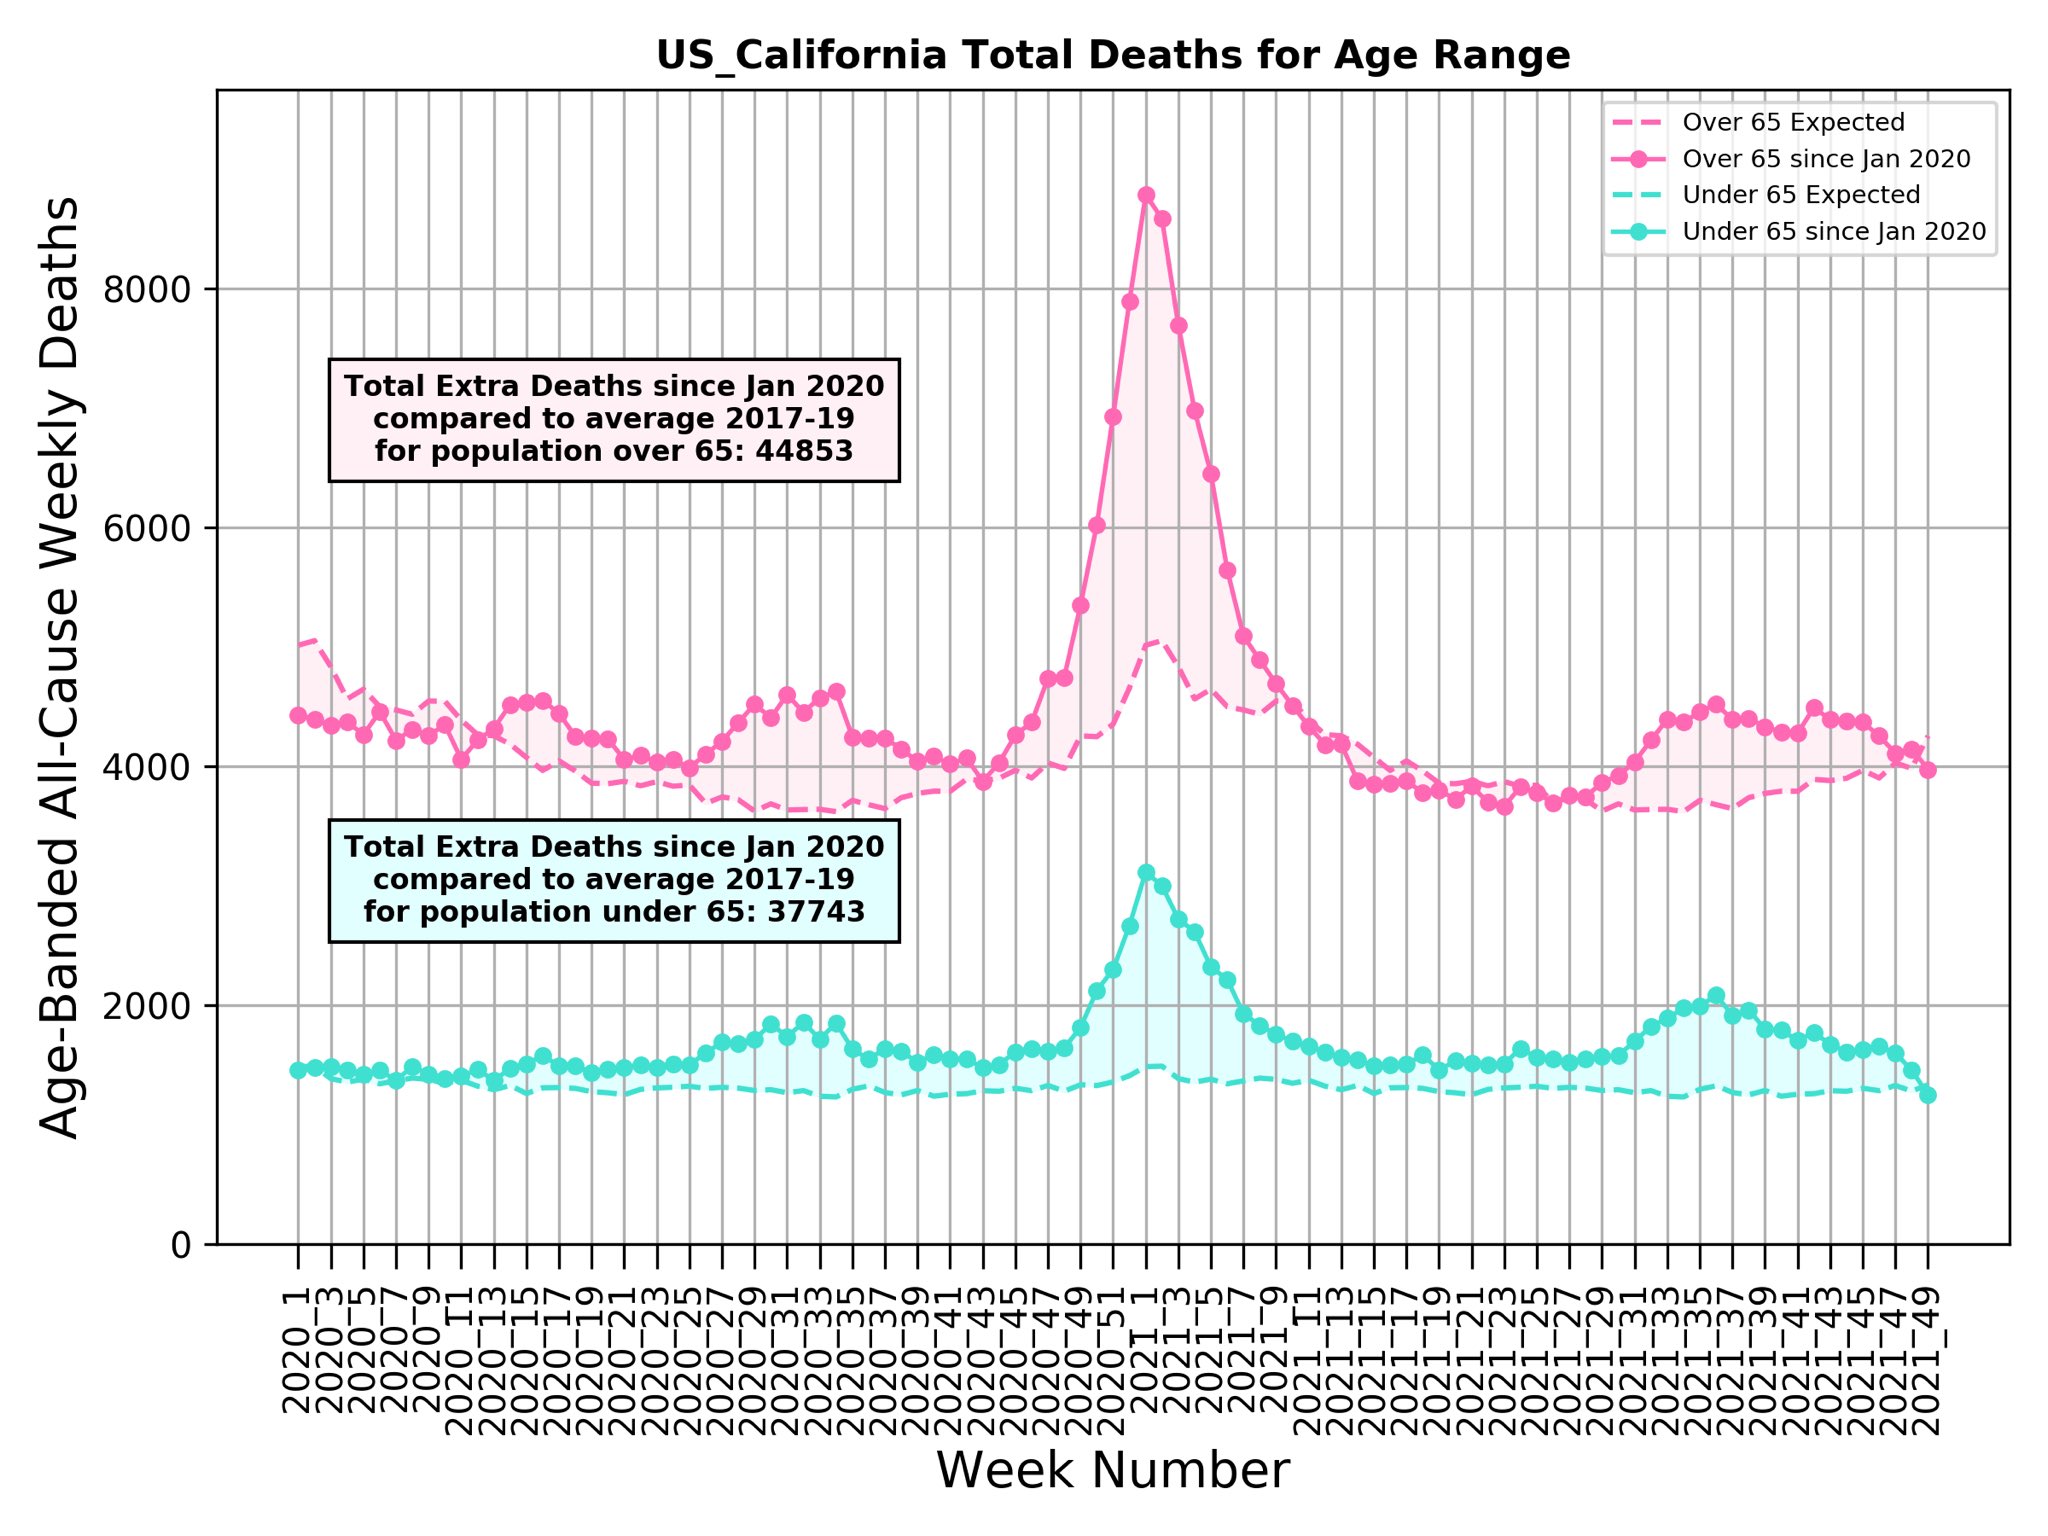
"US excess death Under-65 is finally zero: expected baseline. It went up on 4Apr20, wk14; down on 27Mar22, wk12. This ‘young’ burden of death is unique to the US. True in ‘blue’ California as well as ‘red’ Florida, it signals dangerous weaknesses in US society not seen elsewhere."
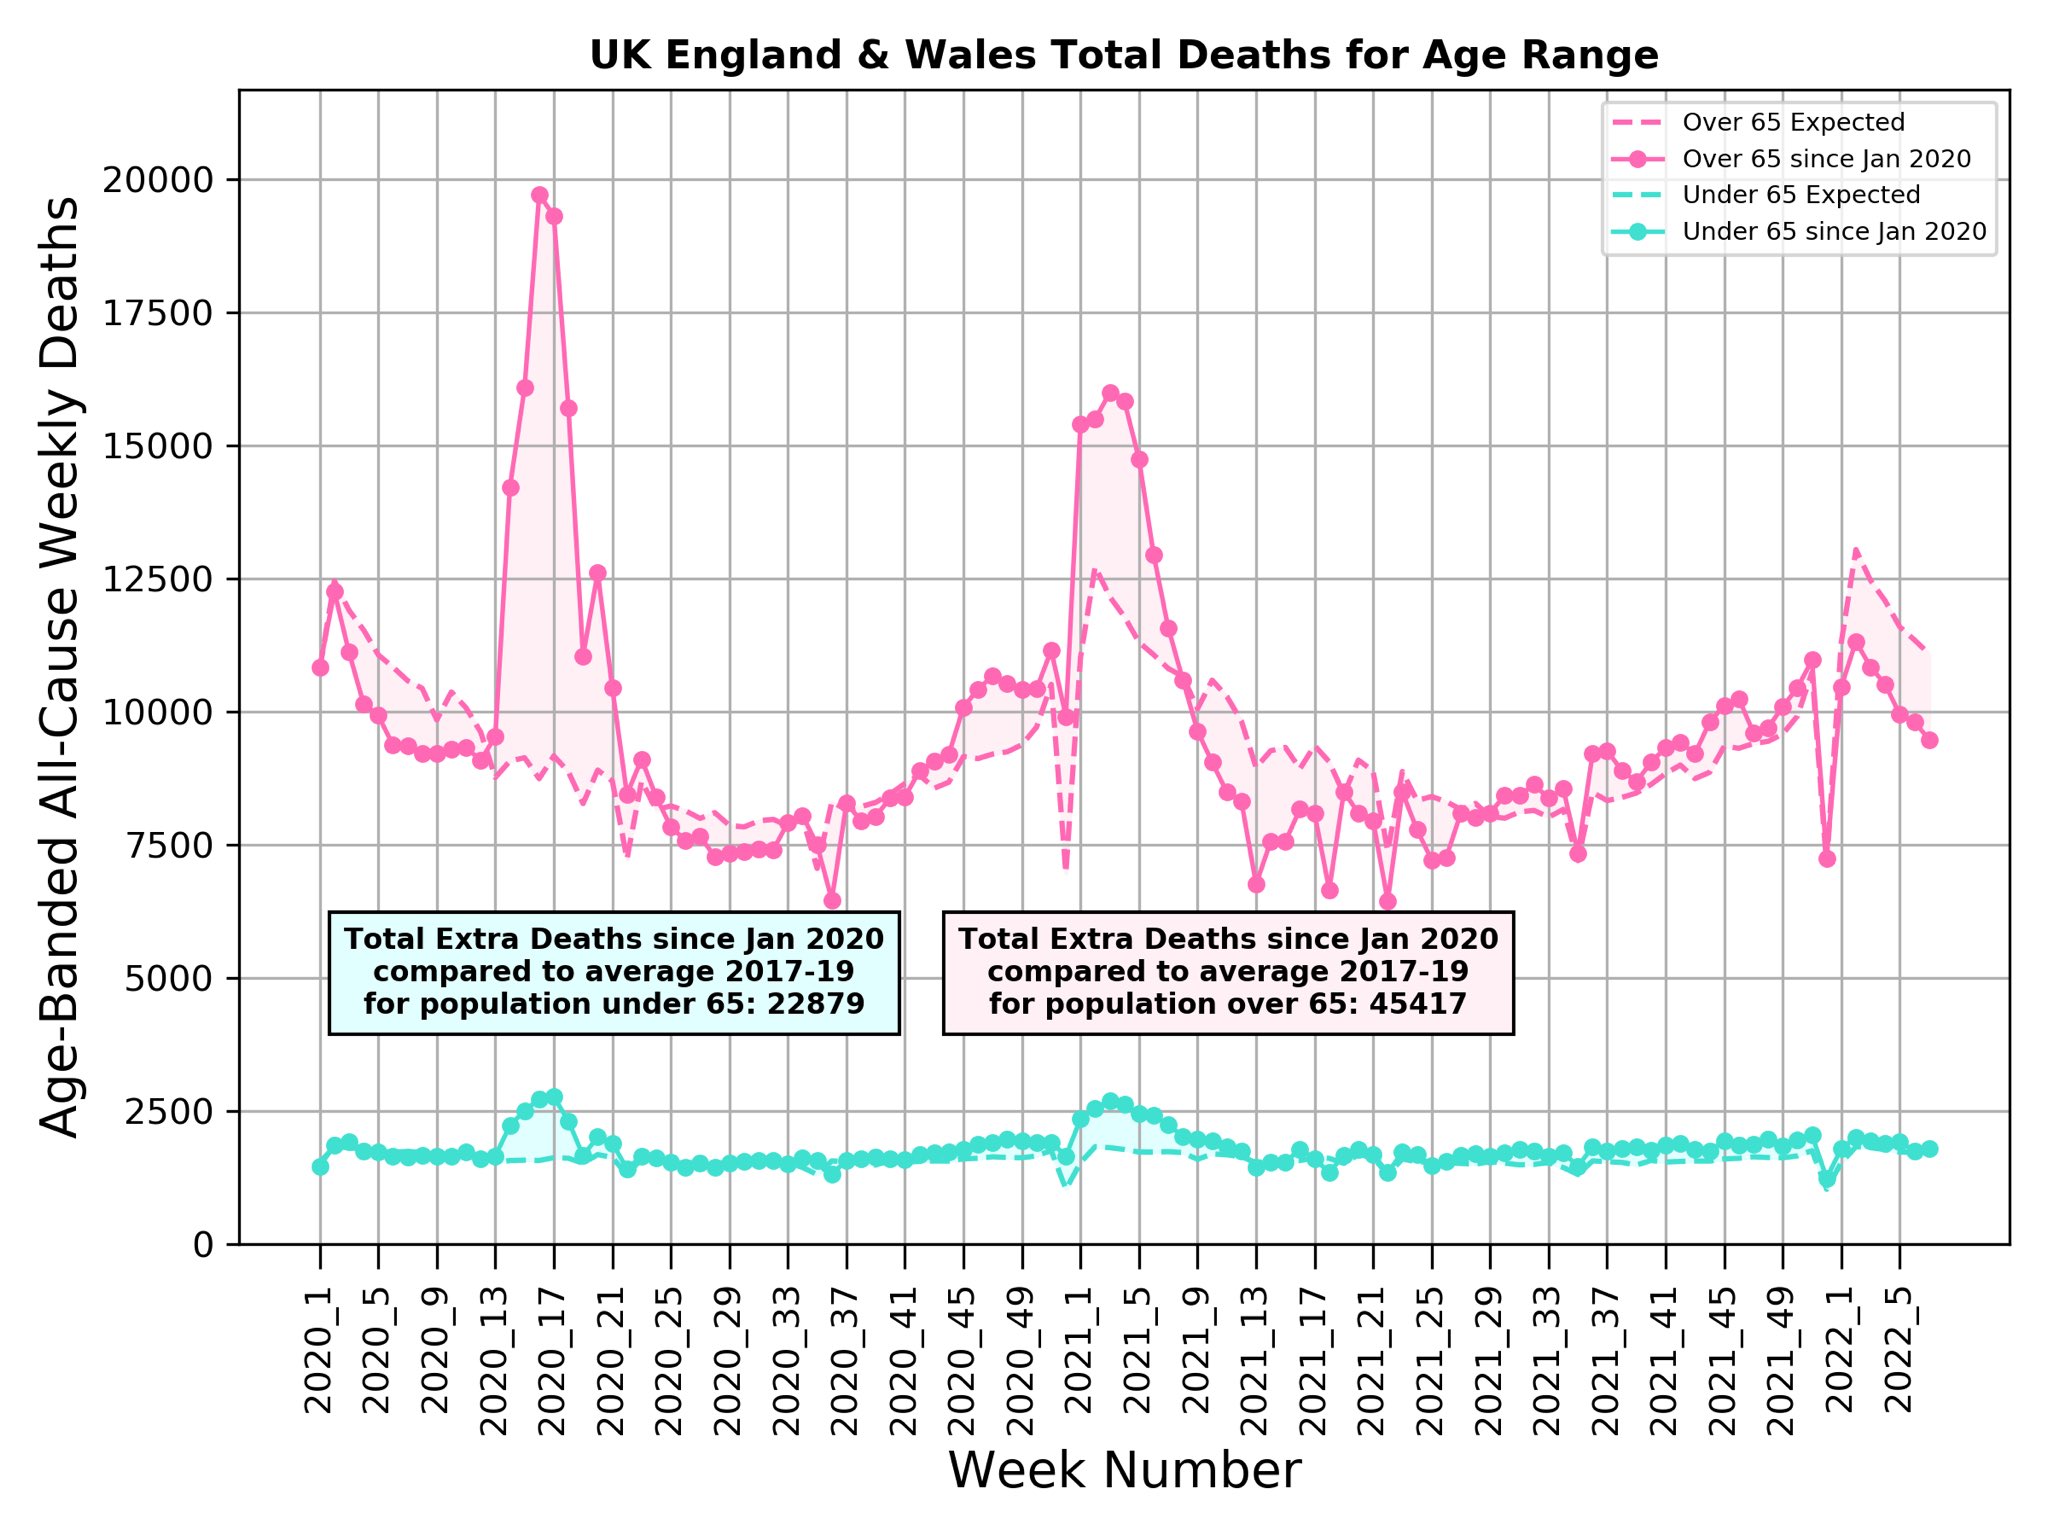
"This is really terrible to read.
UK England & Wales had 27% excess under 65.
Was the same price paid in Sweden? No way as no excess deaths under or over 65 years old.
What about the USA?
Will be even worse than UK as excess deaths under 65 are 37%, a percentage still rising.”
Aug 7:
"The exact same plot for the USA. We deliberately leave off the last six weeks of data to ensure that late reporting delays are minimized.
This is the same 72 week period as shown for Sweden"
4 April:
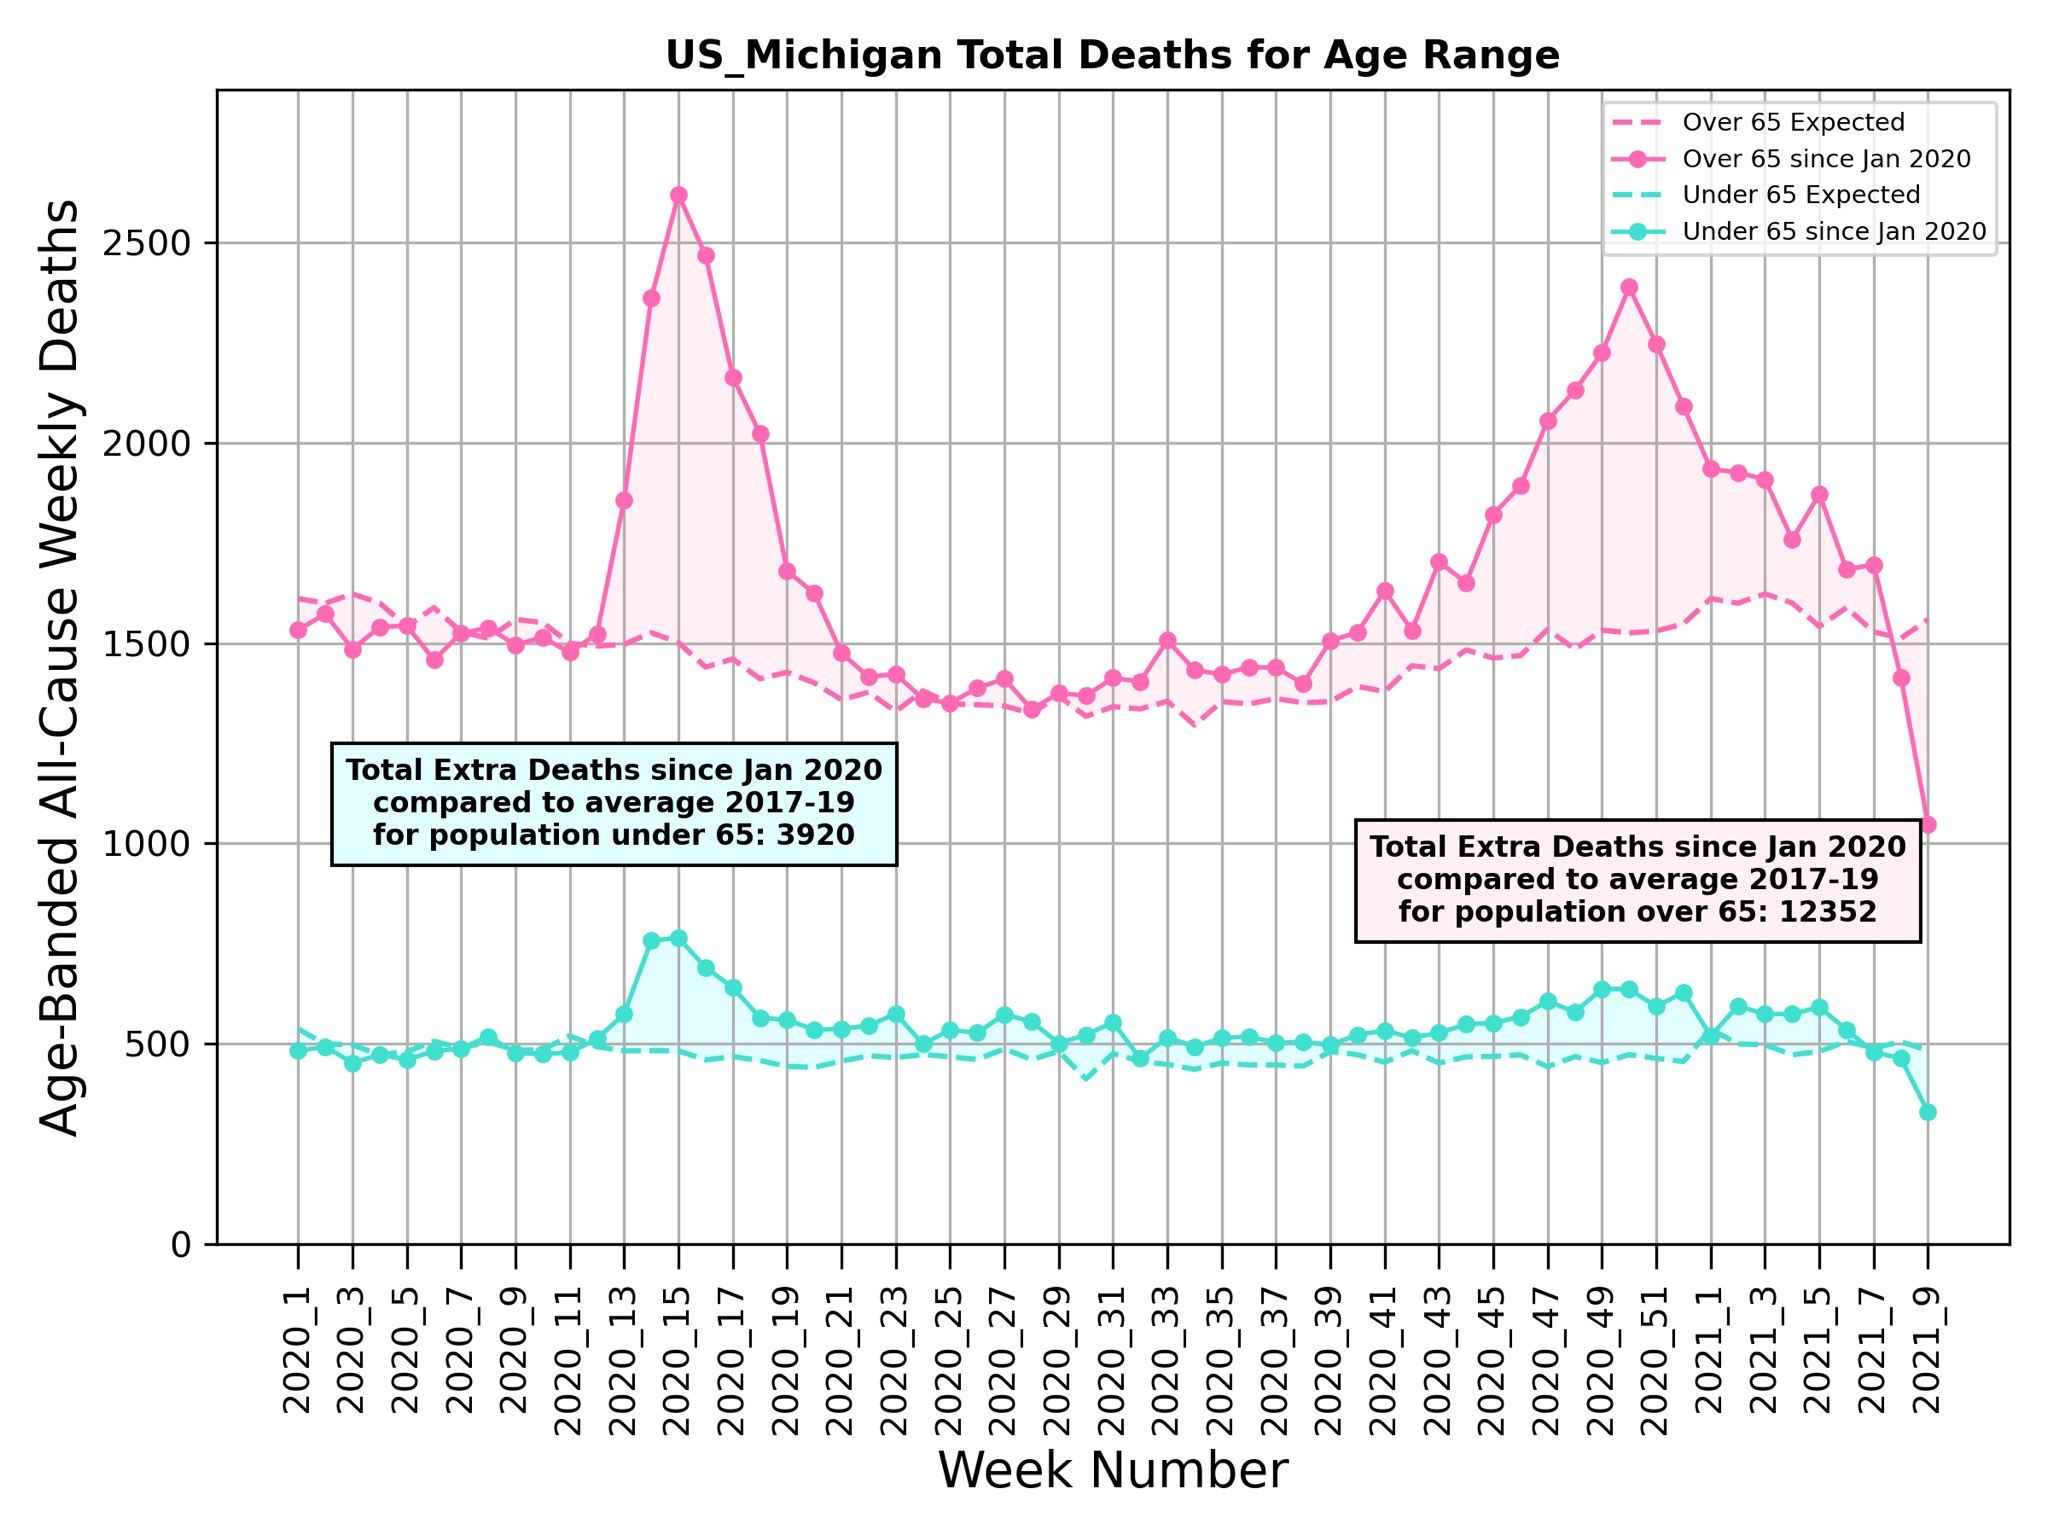
“Michigan serious. Could be catch-up.
MI age-adjusted excess death as % of expected death over 62 weeks is 13.8%, 23rd in list of 50 states.
NY is top at 24.7%. SD is 19.3%, CA is 16.2%, FL is 11.8%. HI is 0.99 & TX is 19.0%.
USA overall is 13.46% or 1.6 months of normal death.”
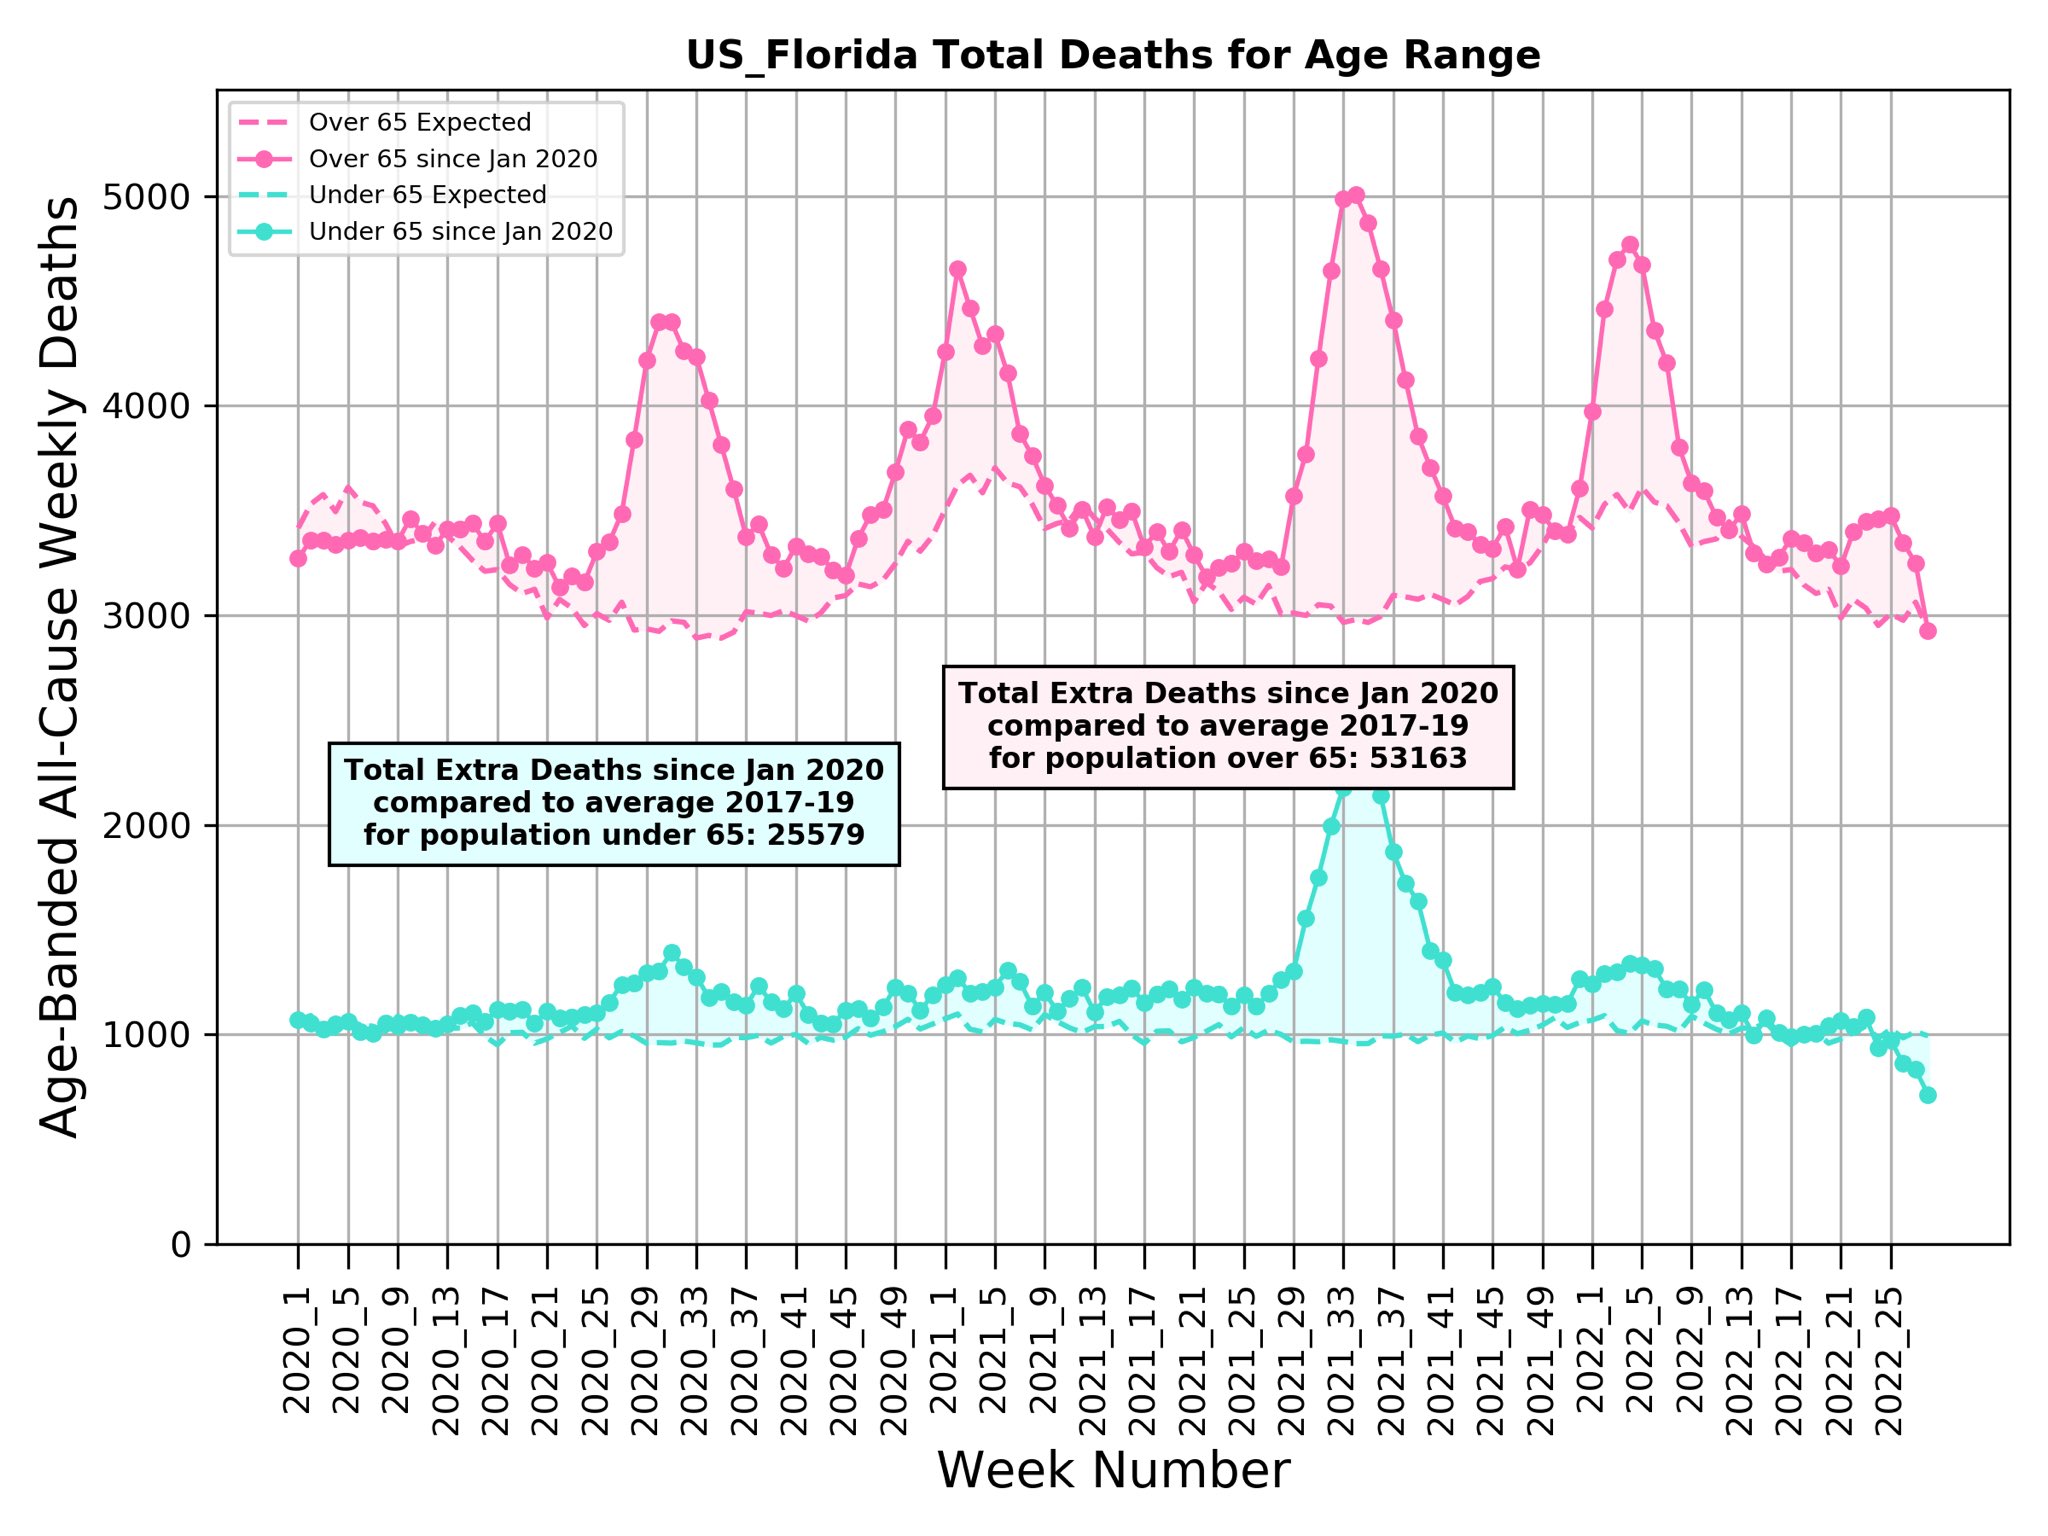
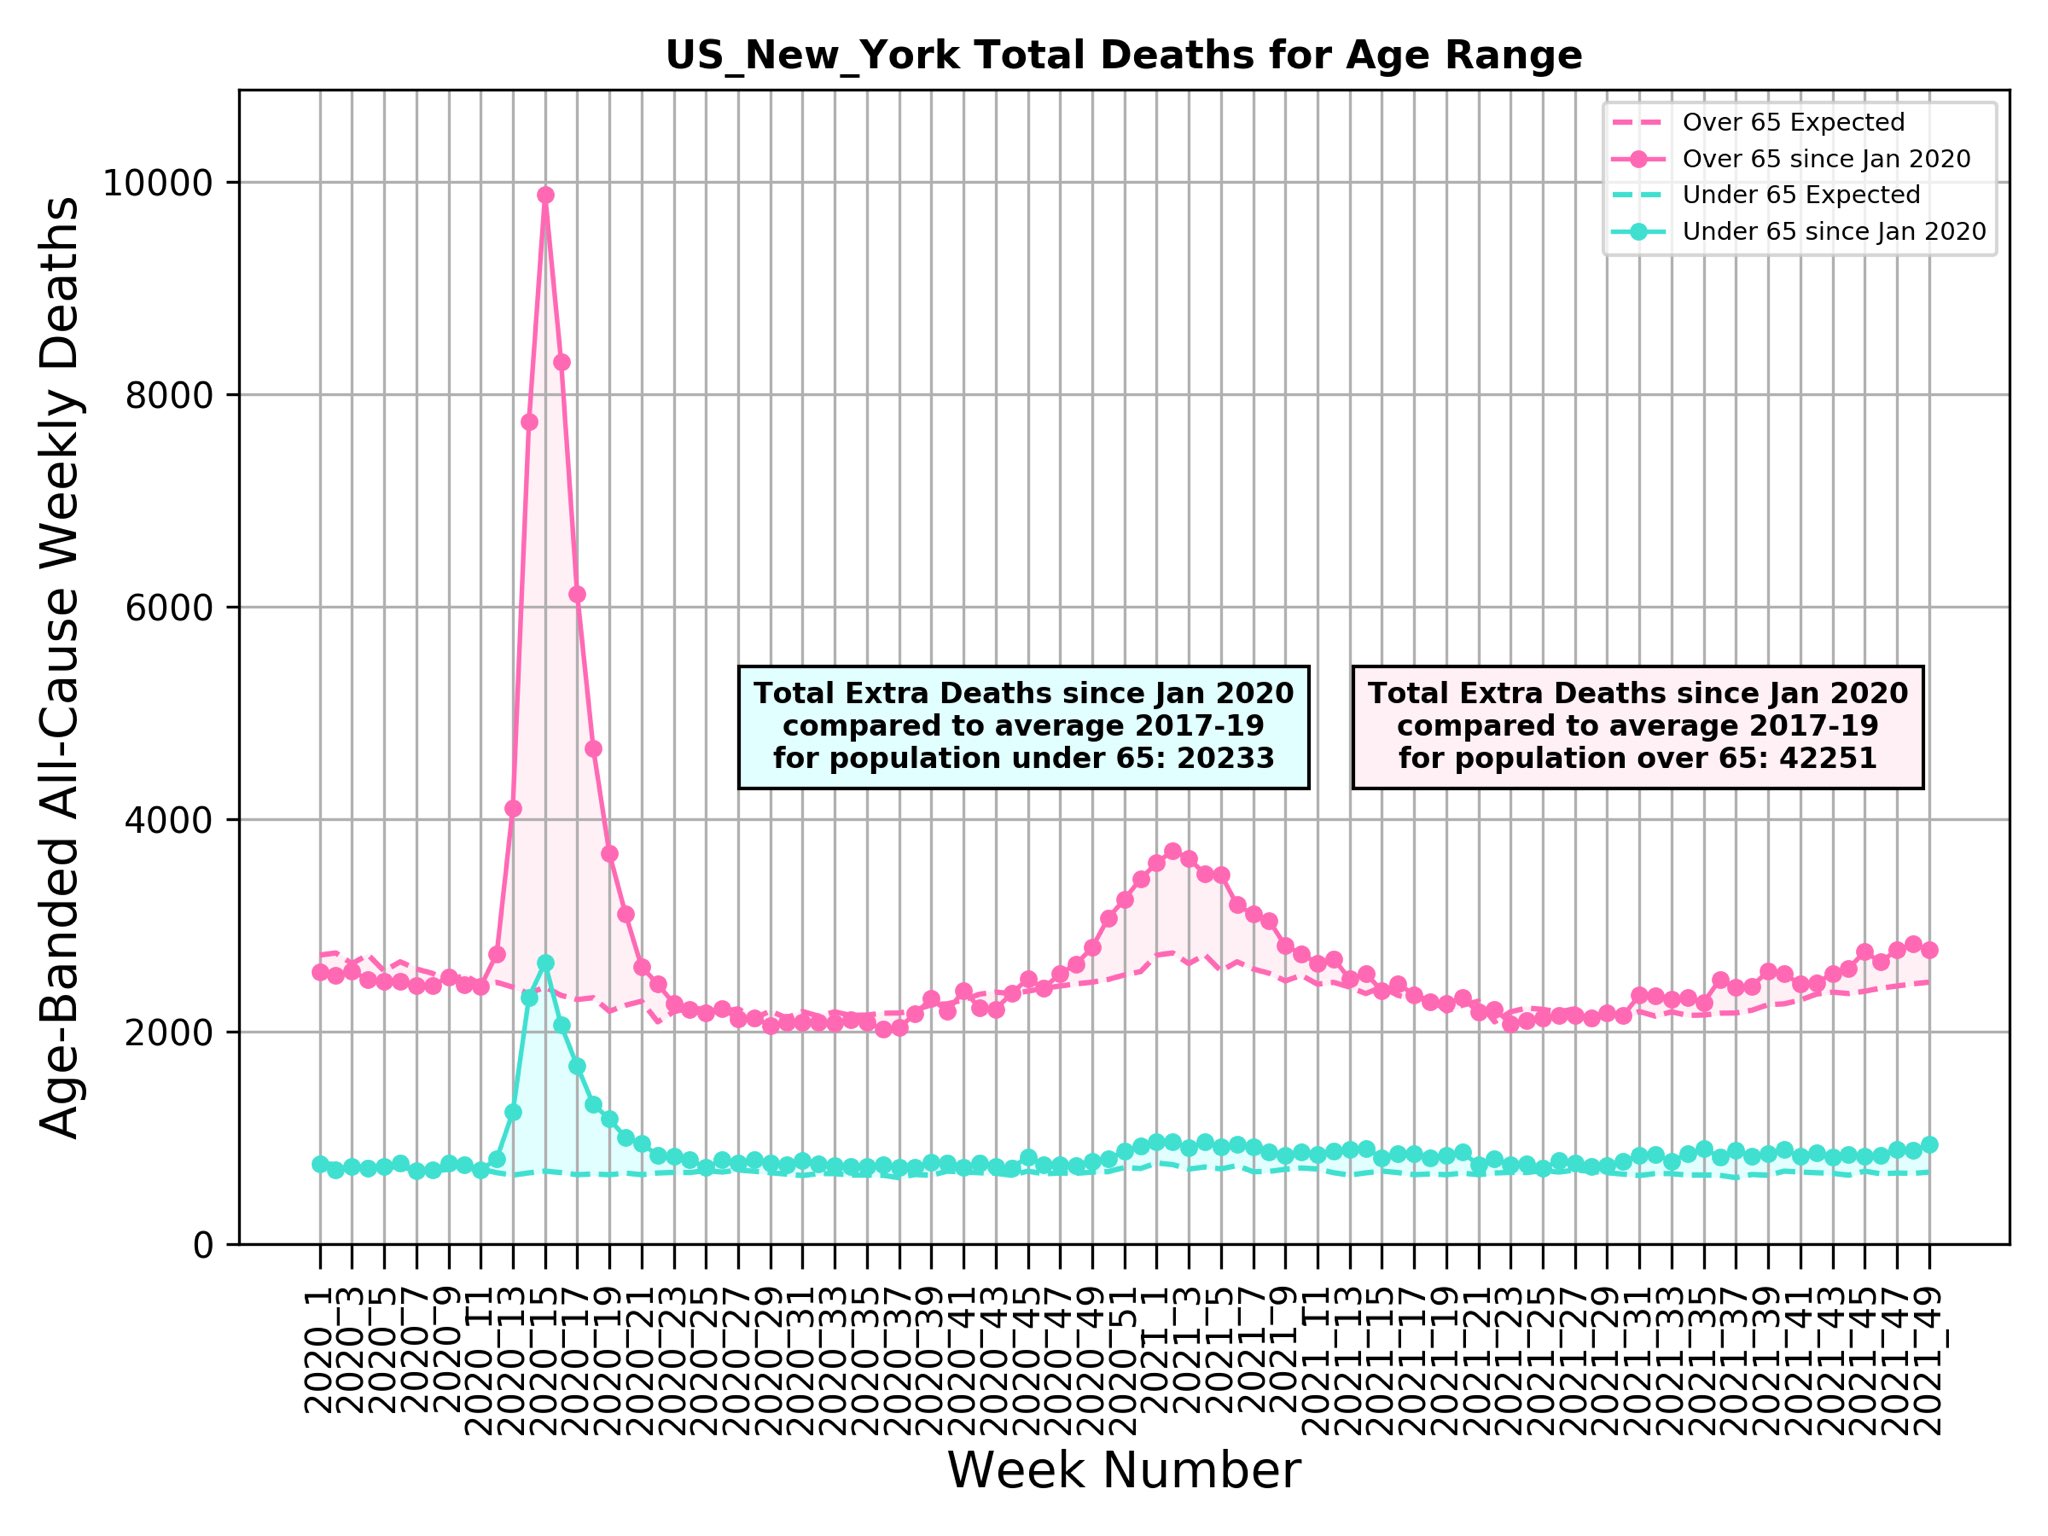
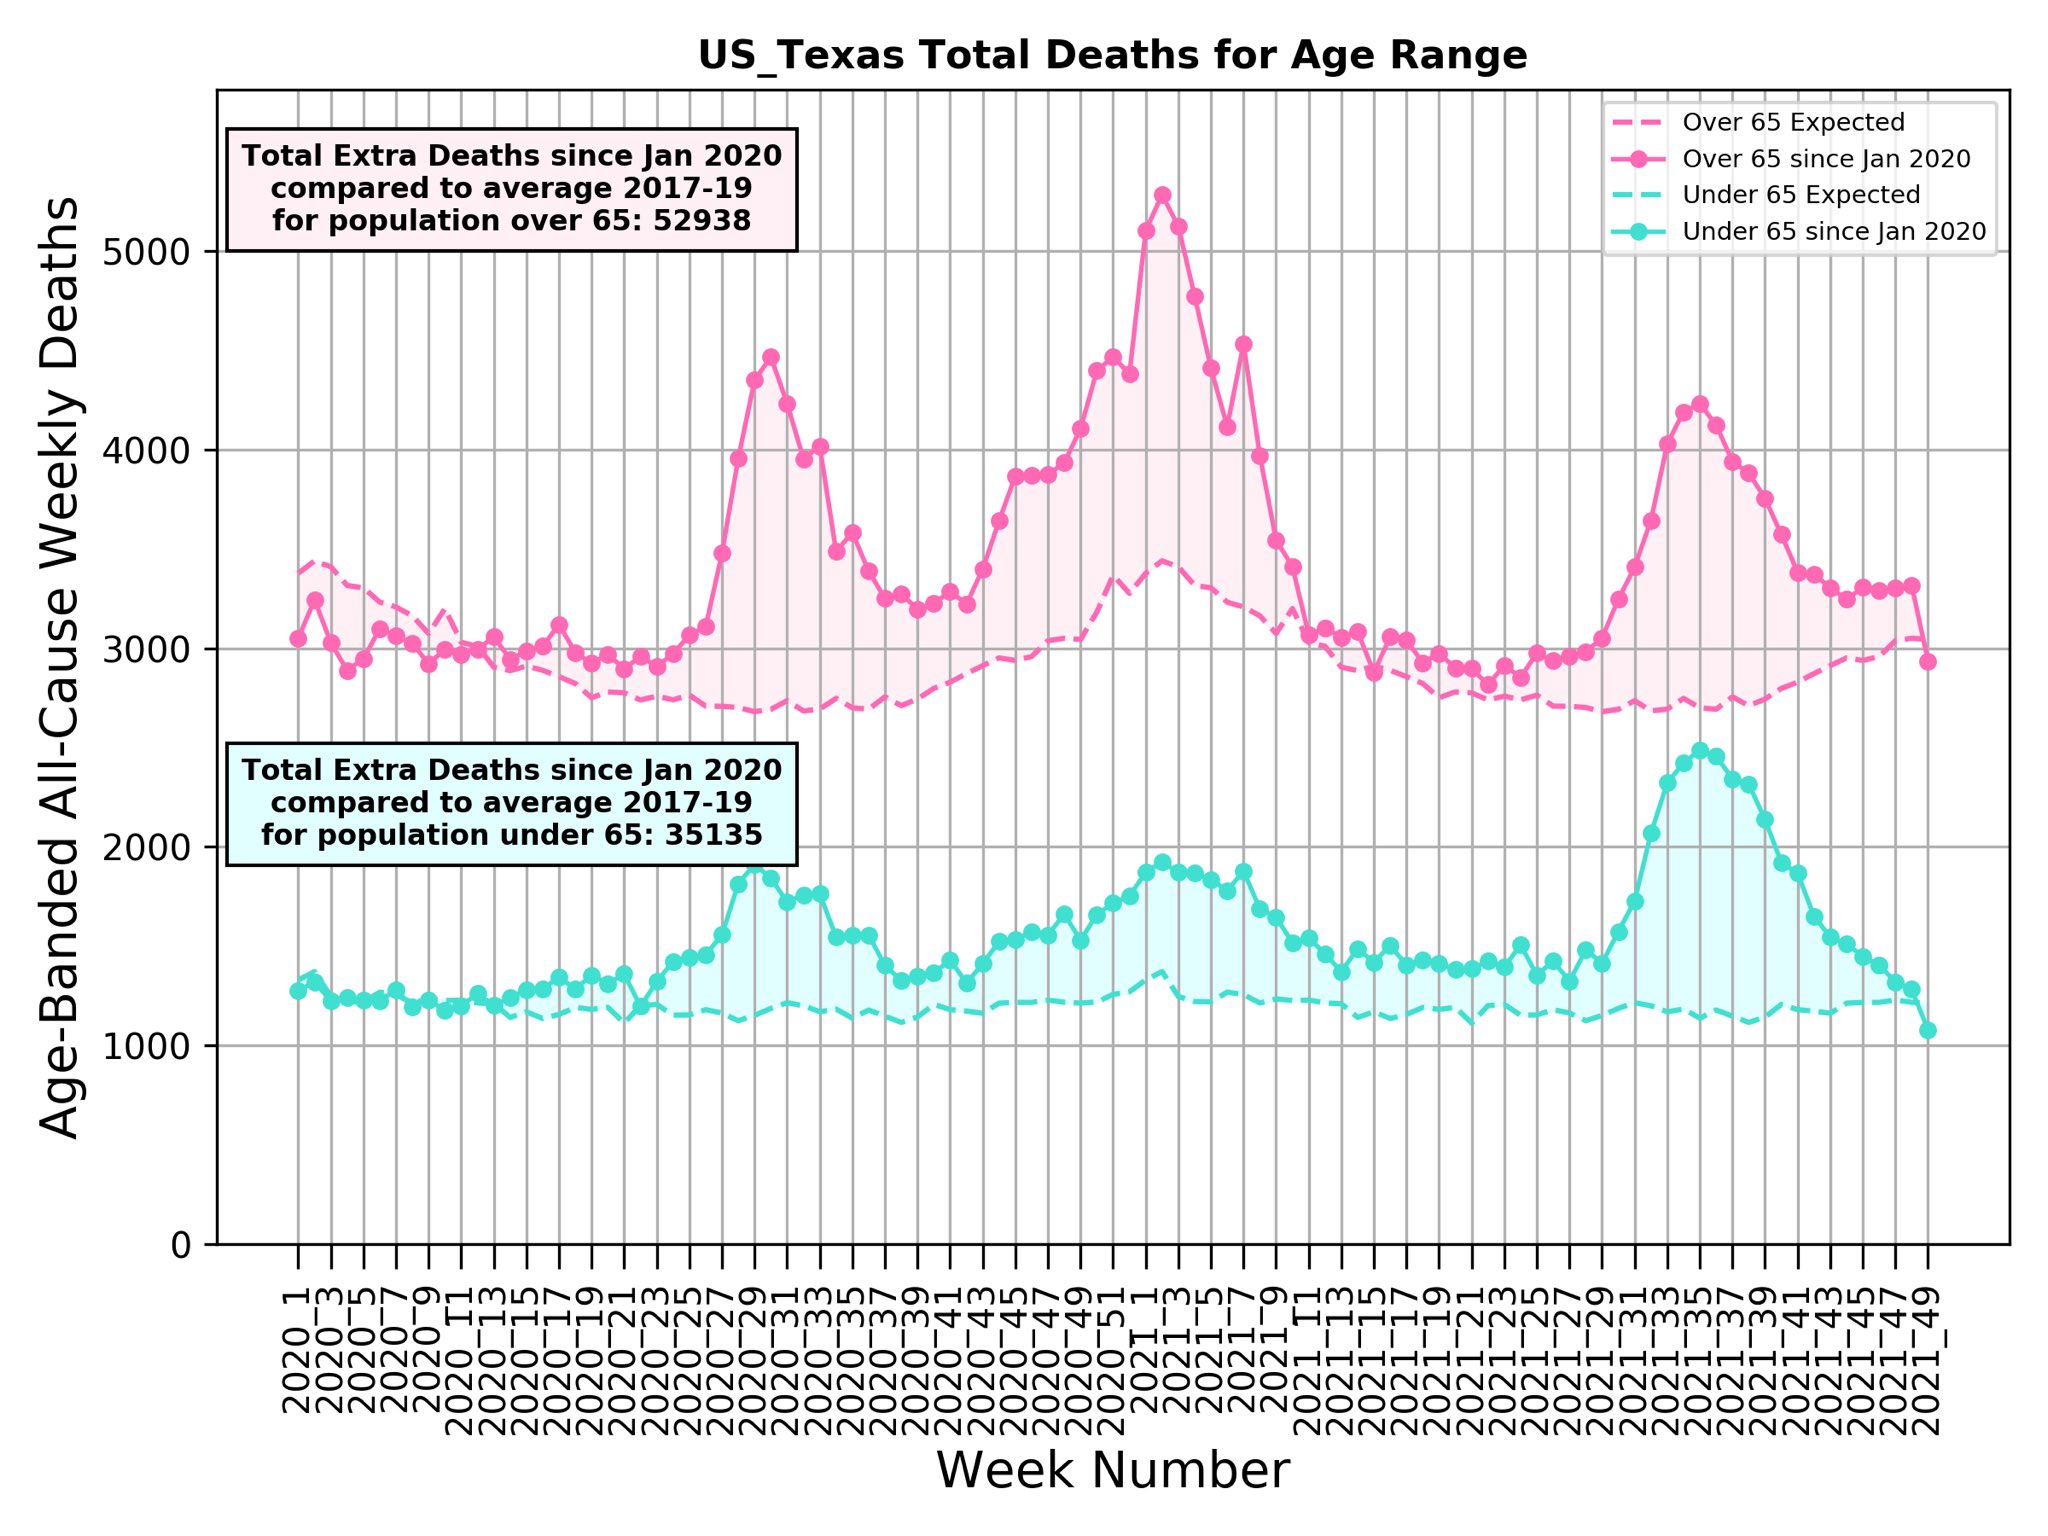
"Age-adjusted all-cause excess death in the 4 biggest US States (California, New York, Florida, Texas) has a different pattern in each.
They all reach very similar levels of COVID-era excess death as a percentage of normal death.
This suggests saturation that can be reached in many different ways.
"Age-adjusted all-cause excess death in the 4 biggest US States (California, New York, Florida, Texas) has a different pattern in each.
They all reach very similar levels of COVID-era excess death as a percentage of normal death.
This suggests saturation that can be reached in many different ways.
"Age-adjusted all-cause excess death in the 4 biggest US States (California, New York, Florida, Texas) has a different pattern in each.
They all reach very similar levels of COVID-era excess death as a percentage of normal death.
This suggests saturation that can be reached in many different ways.
"Age-adjusted all-cause excess death in the 4 biggest US States (California, New York, Florida, Texas) has a different pattern in each.
They all reach very similar levels of COVID-era excess death as a percentage of normal death.
This suggests saturation that can be reached in many different ways.
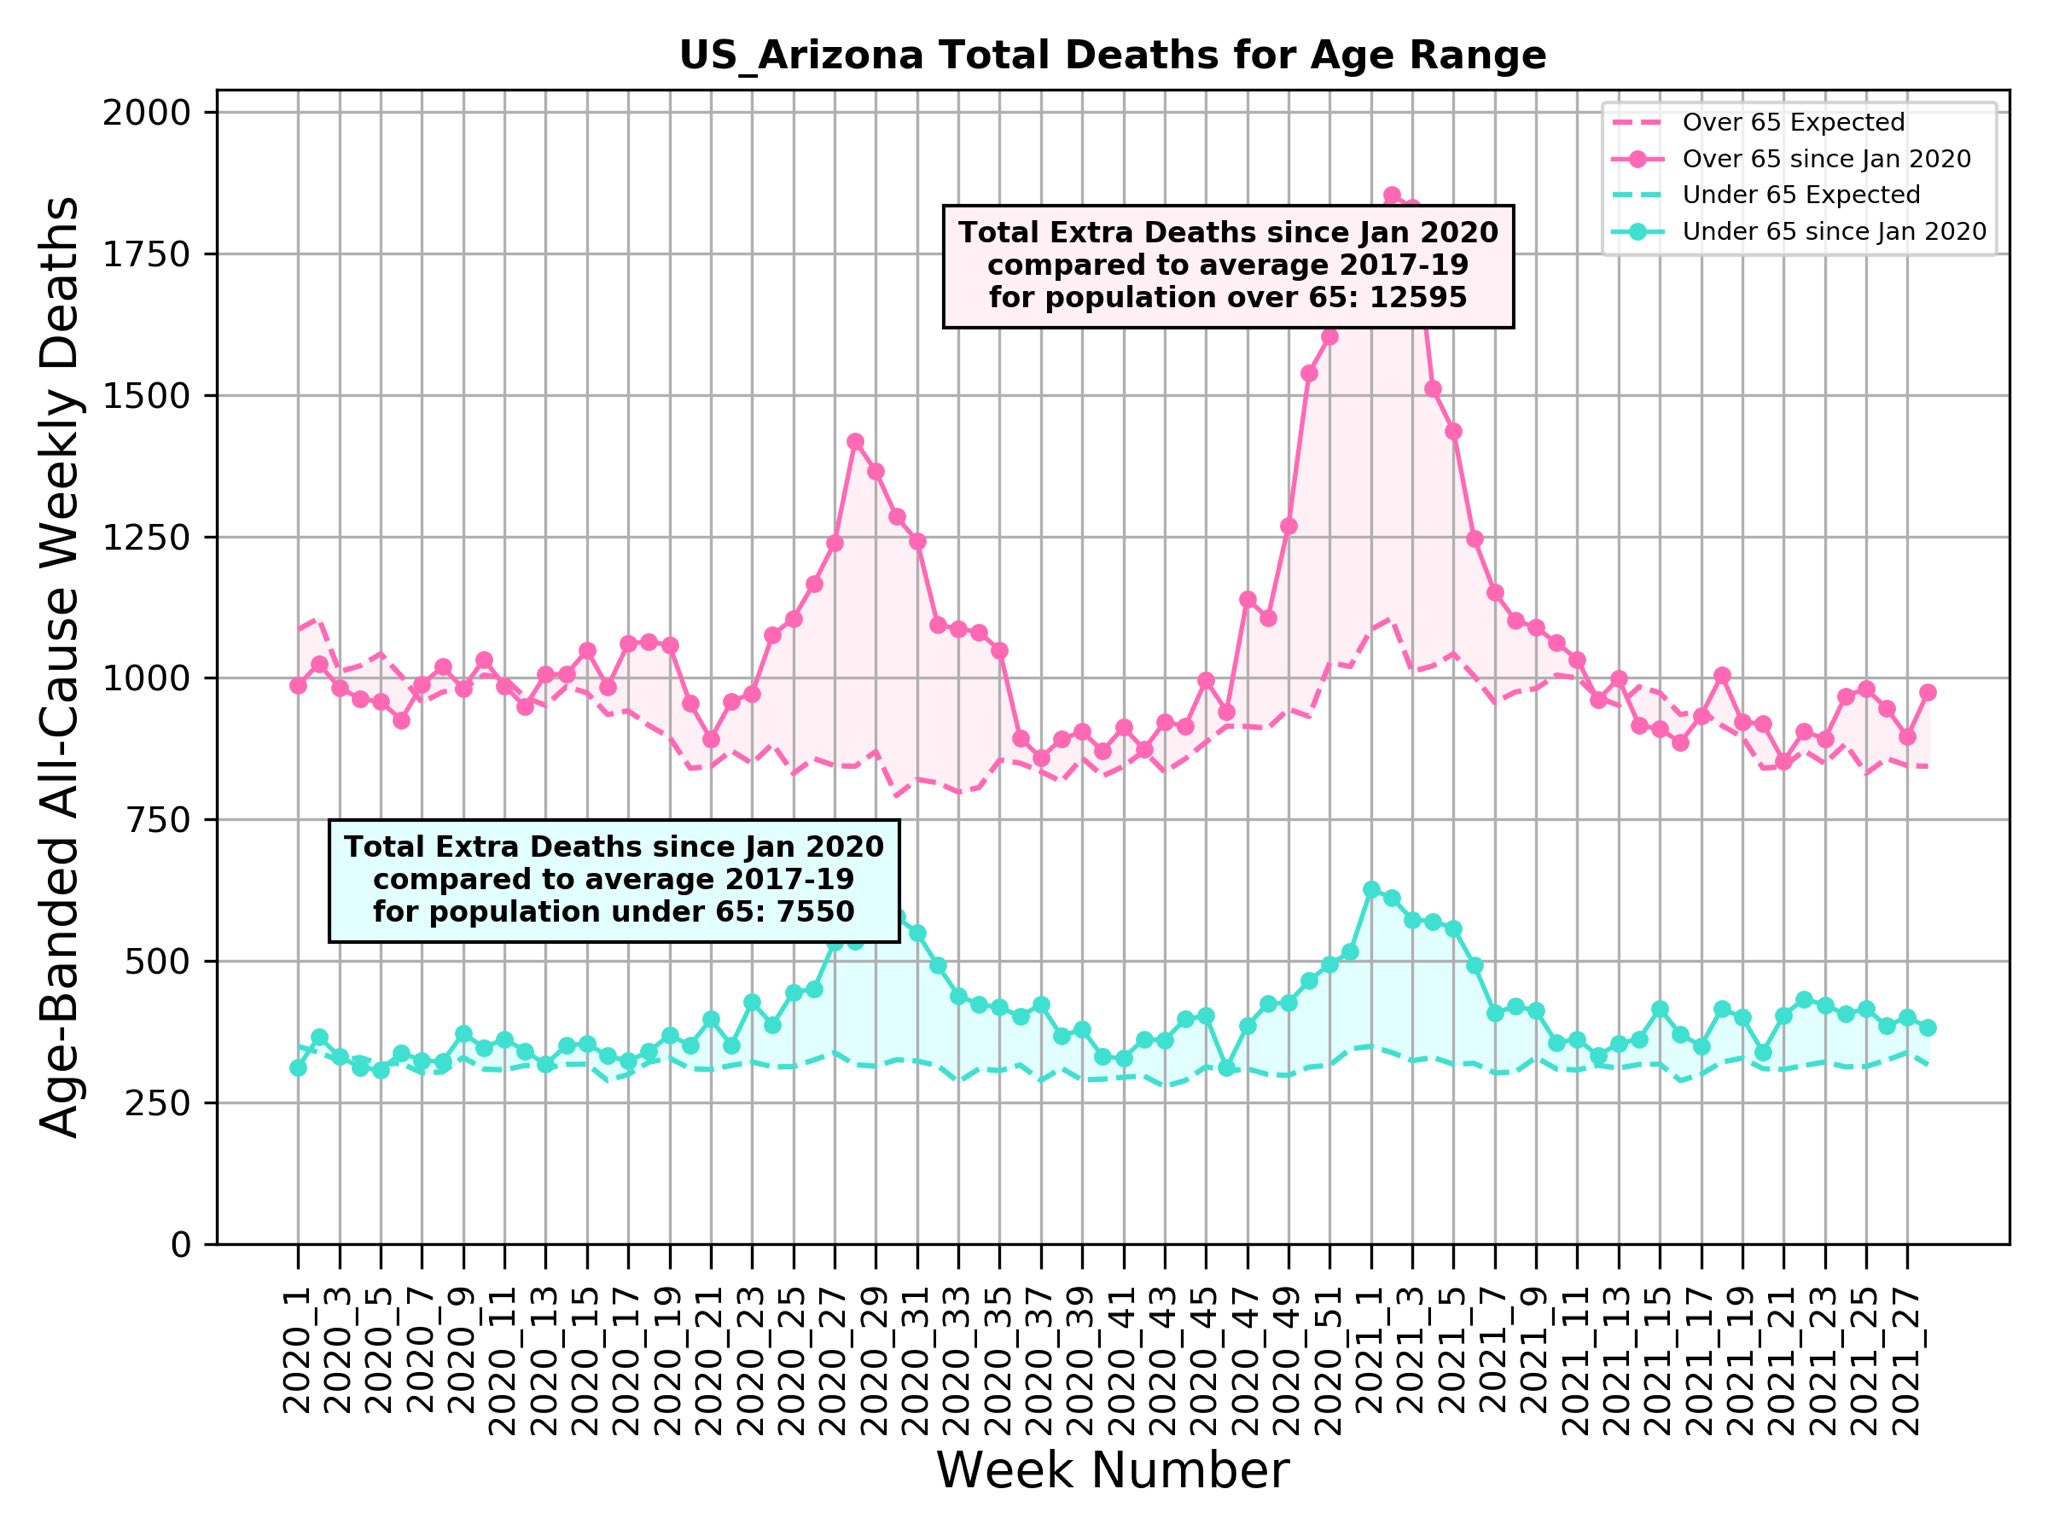
NOTE: TOTAL excess death: 20145 ; for ages under 65 = 7550 ; for ages over 65 = 12595 ;
Week 28 2021 (18 July)
Michigen
4 April:
“Michigan serious. Could be catch-up.
MI age-adjusted excess death as % of expected death over 62 weeks is 13.8%, 23rd in list of 50 states.
NY is top at 24.7%. SD is 19.3%, CA is 16.2%, FL is 11.8%. HI is 0.99 & TX is 19.0%.
USA overall is 13.46% or 1.6 months of normal death.”
16 Mar 2021
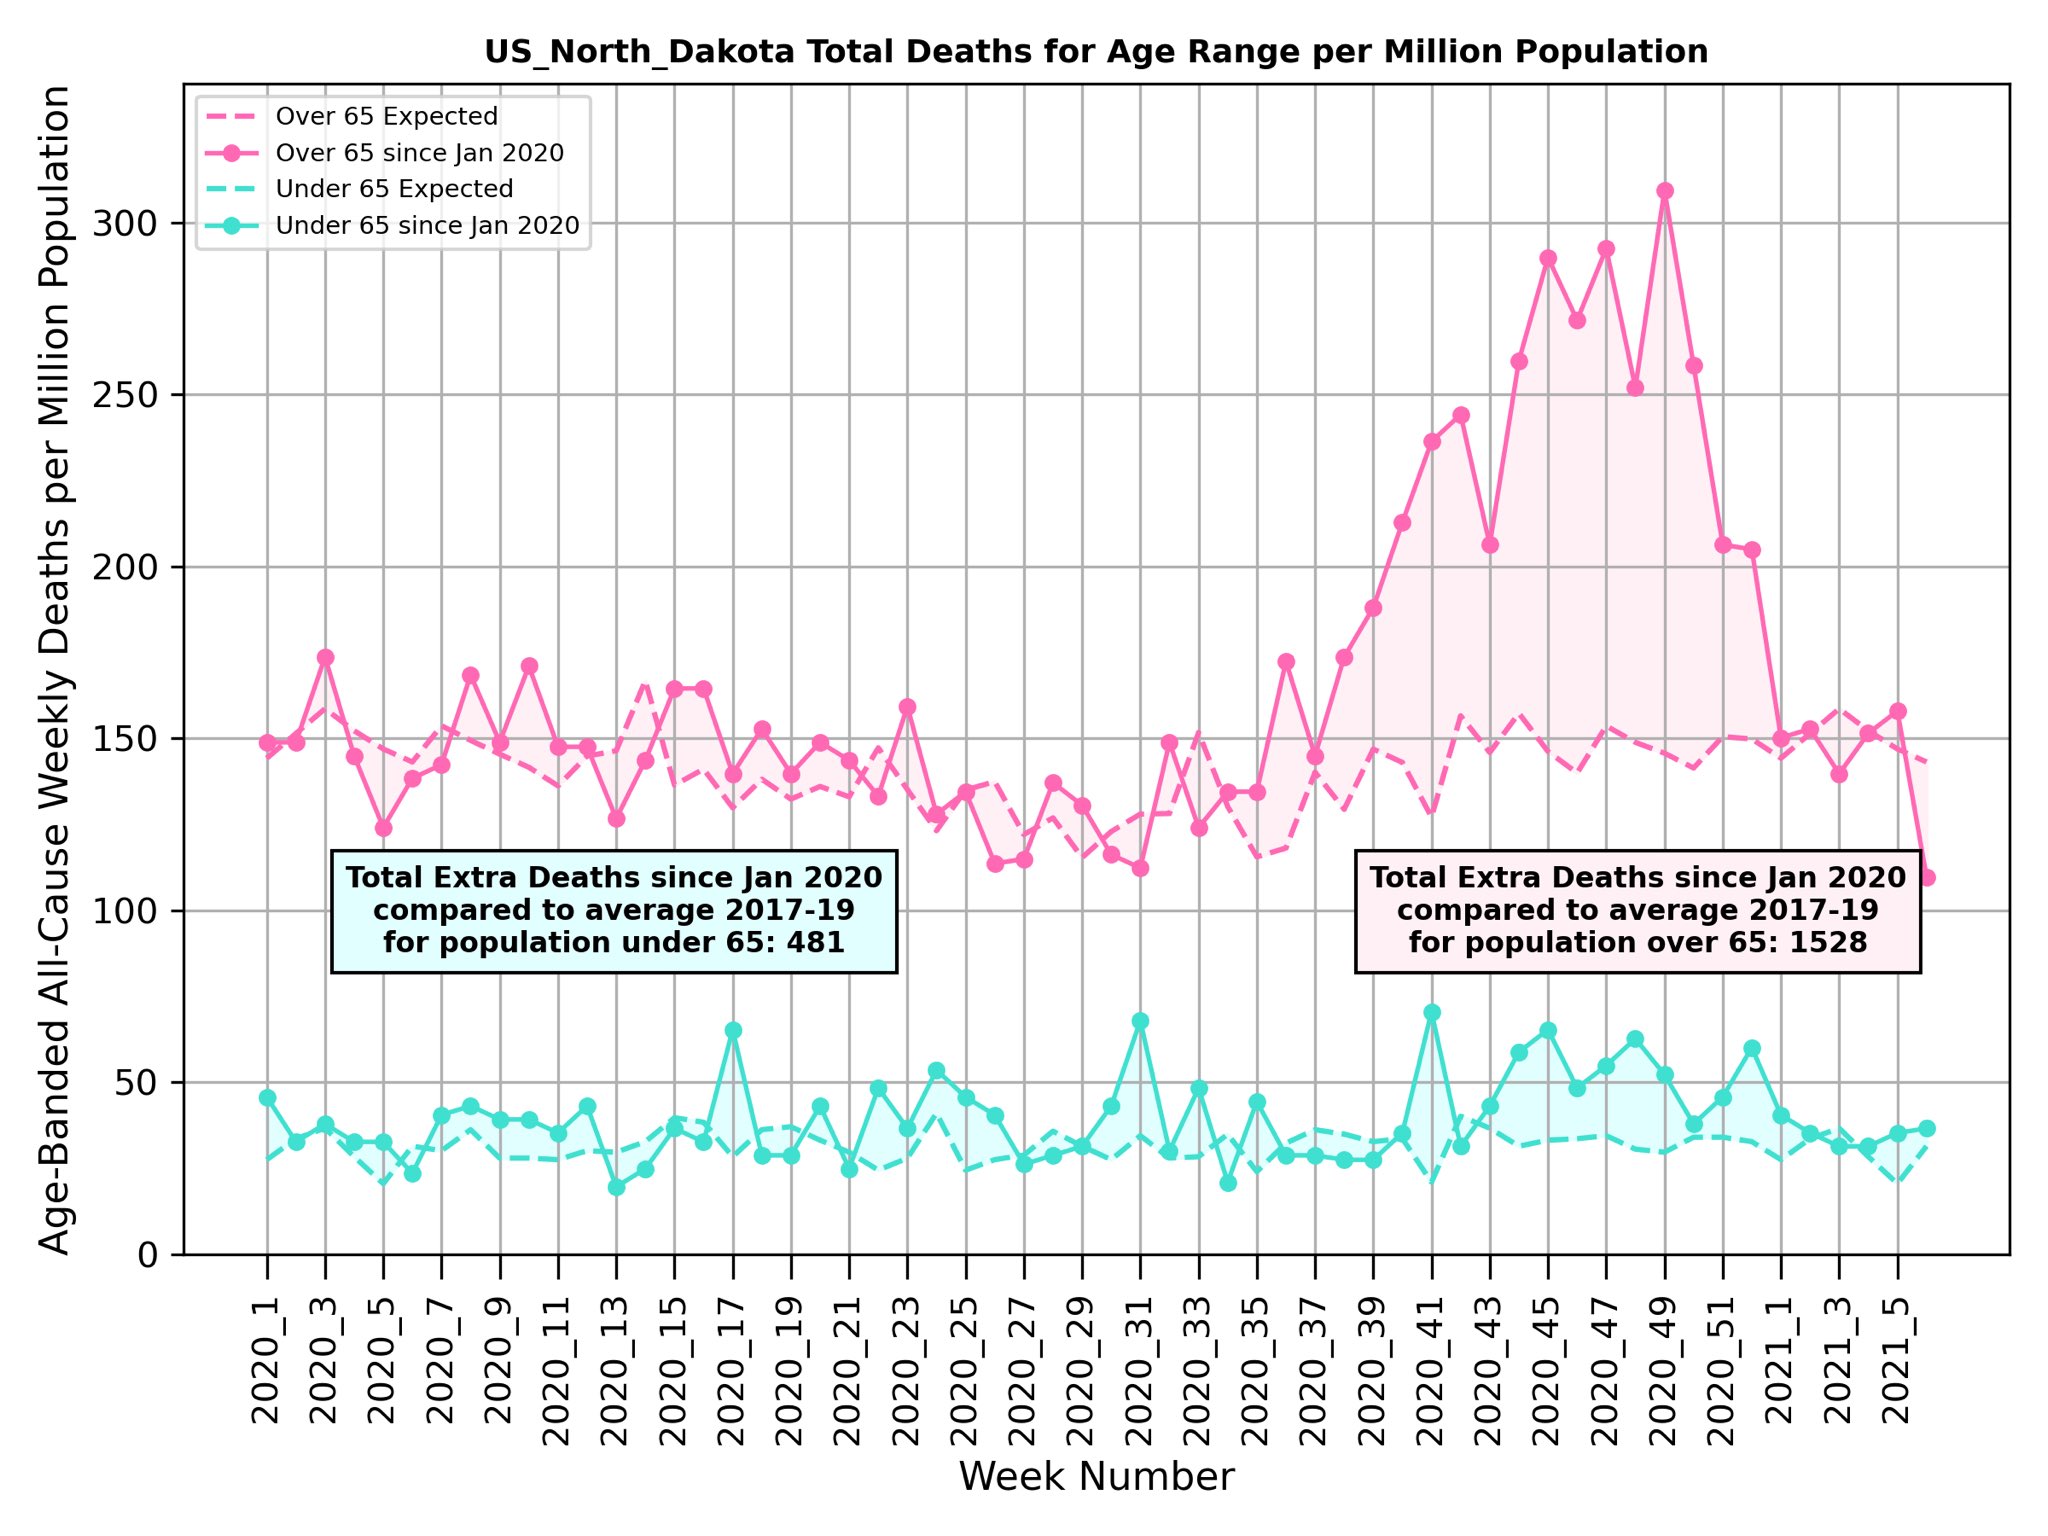
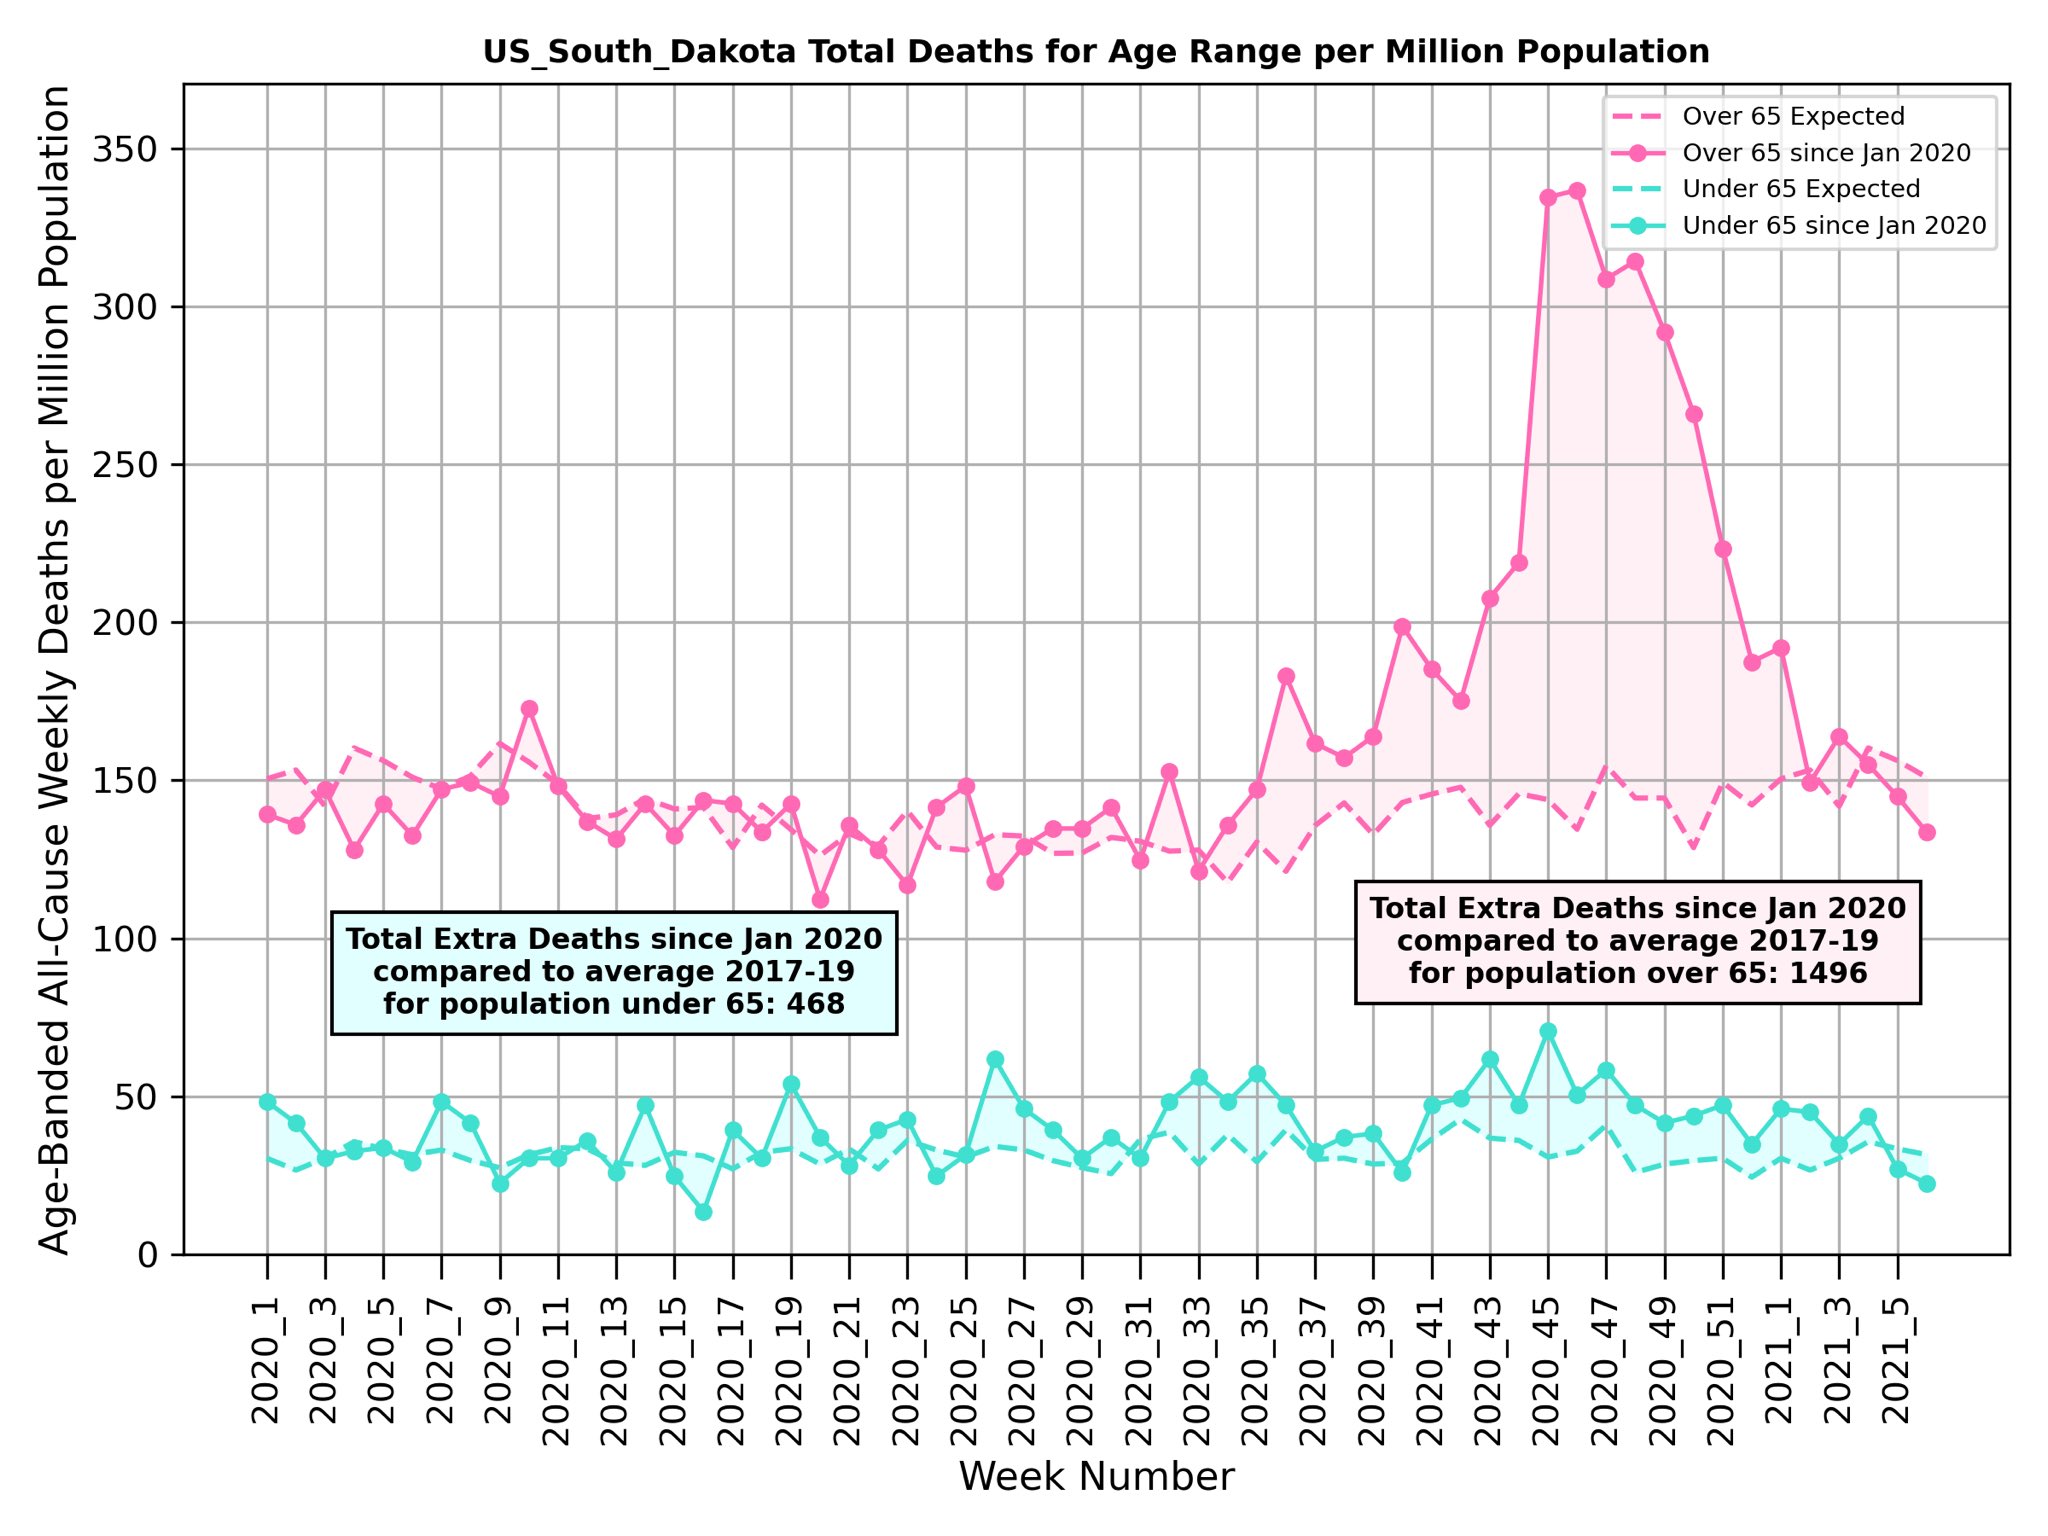
"Age-adjusted excess deaths we have calculated for North Dakota & South Dakota.
In both the total death per million is high at 2,009 for ND & 1,964 for SD from start 2020 to mid-Feb 2021. In both excess death is back to baseline.
How similar were Covid19 restrictions in ND & SD? "
"Important to note that in our plots the deaths are per million total population and not per million of the age group considered. We are making these as well.
Population of North Dakota is is 757,000 whereas that of South Dakota is 858,000 so very similar."
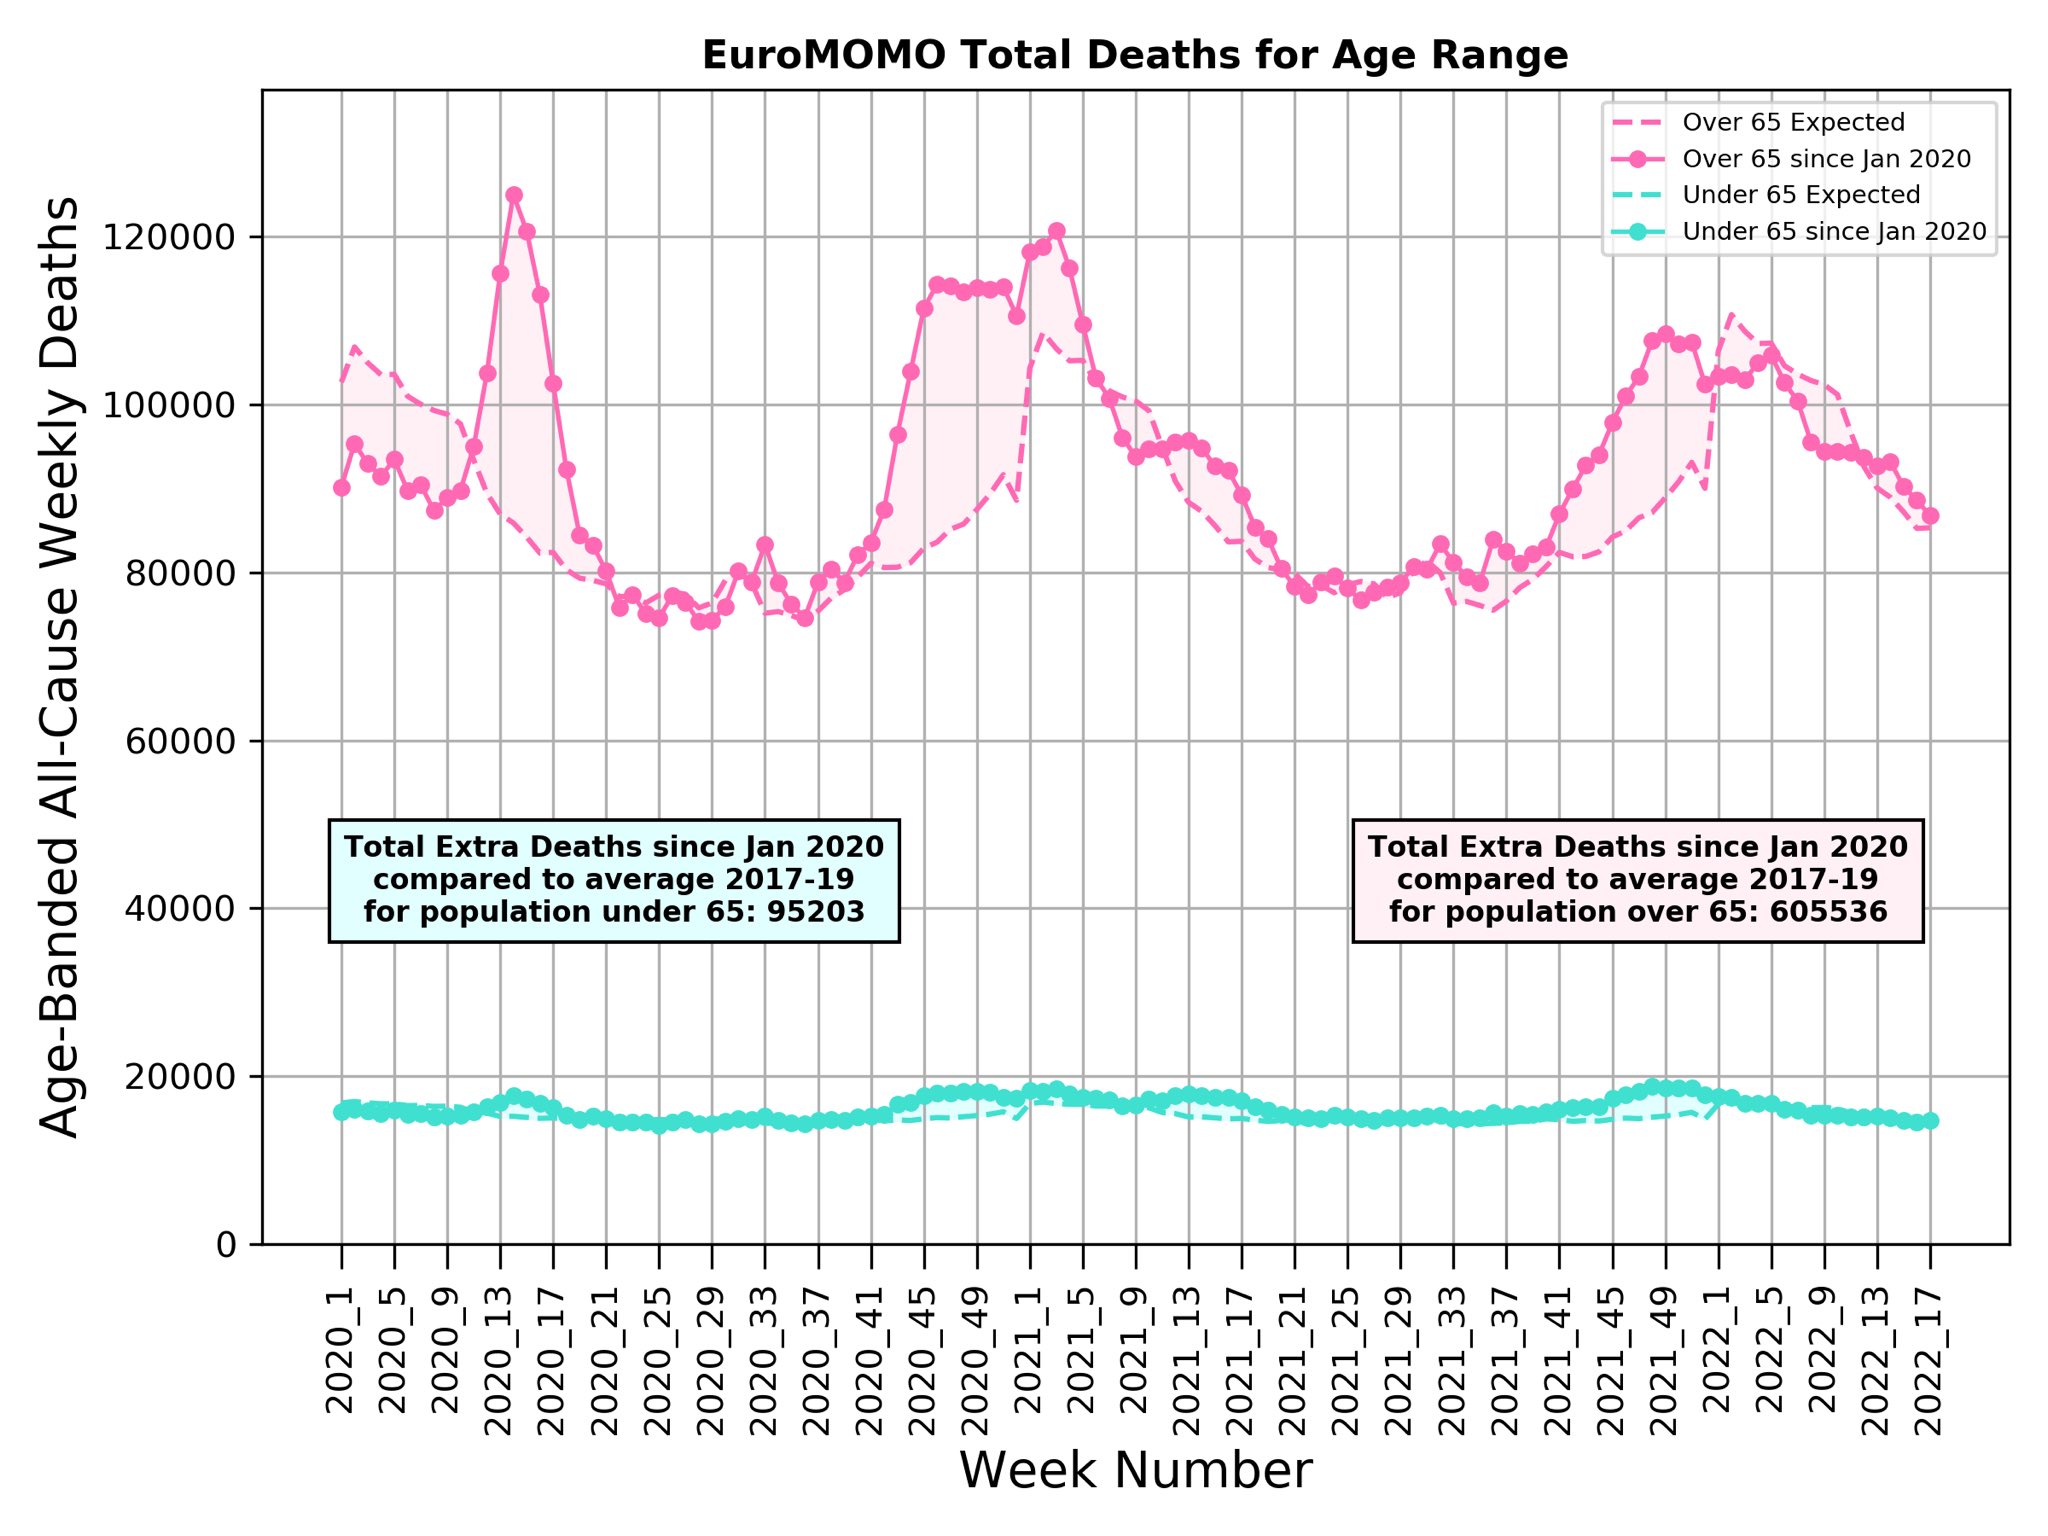
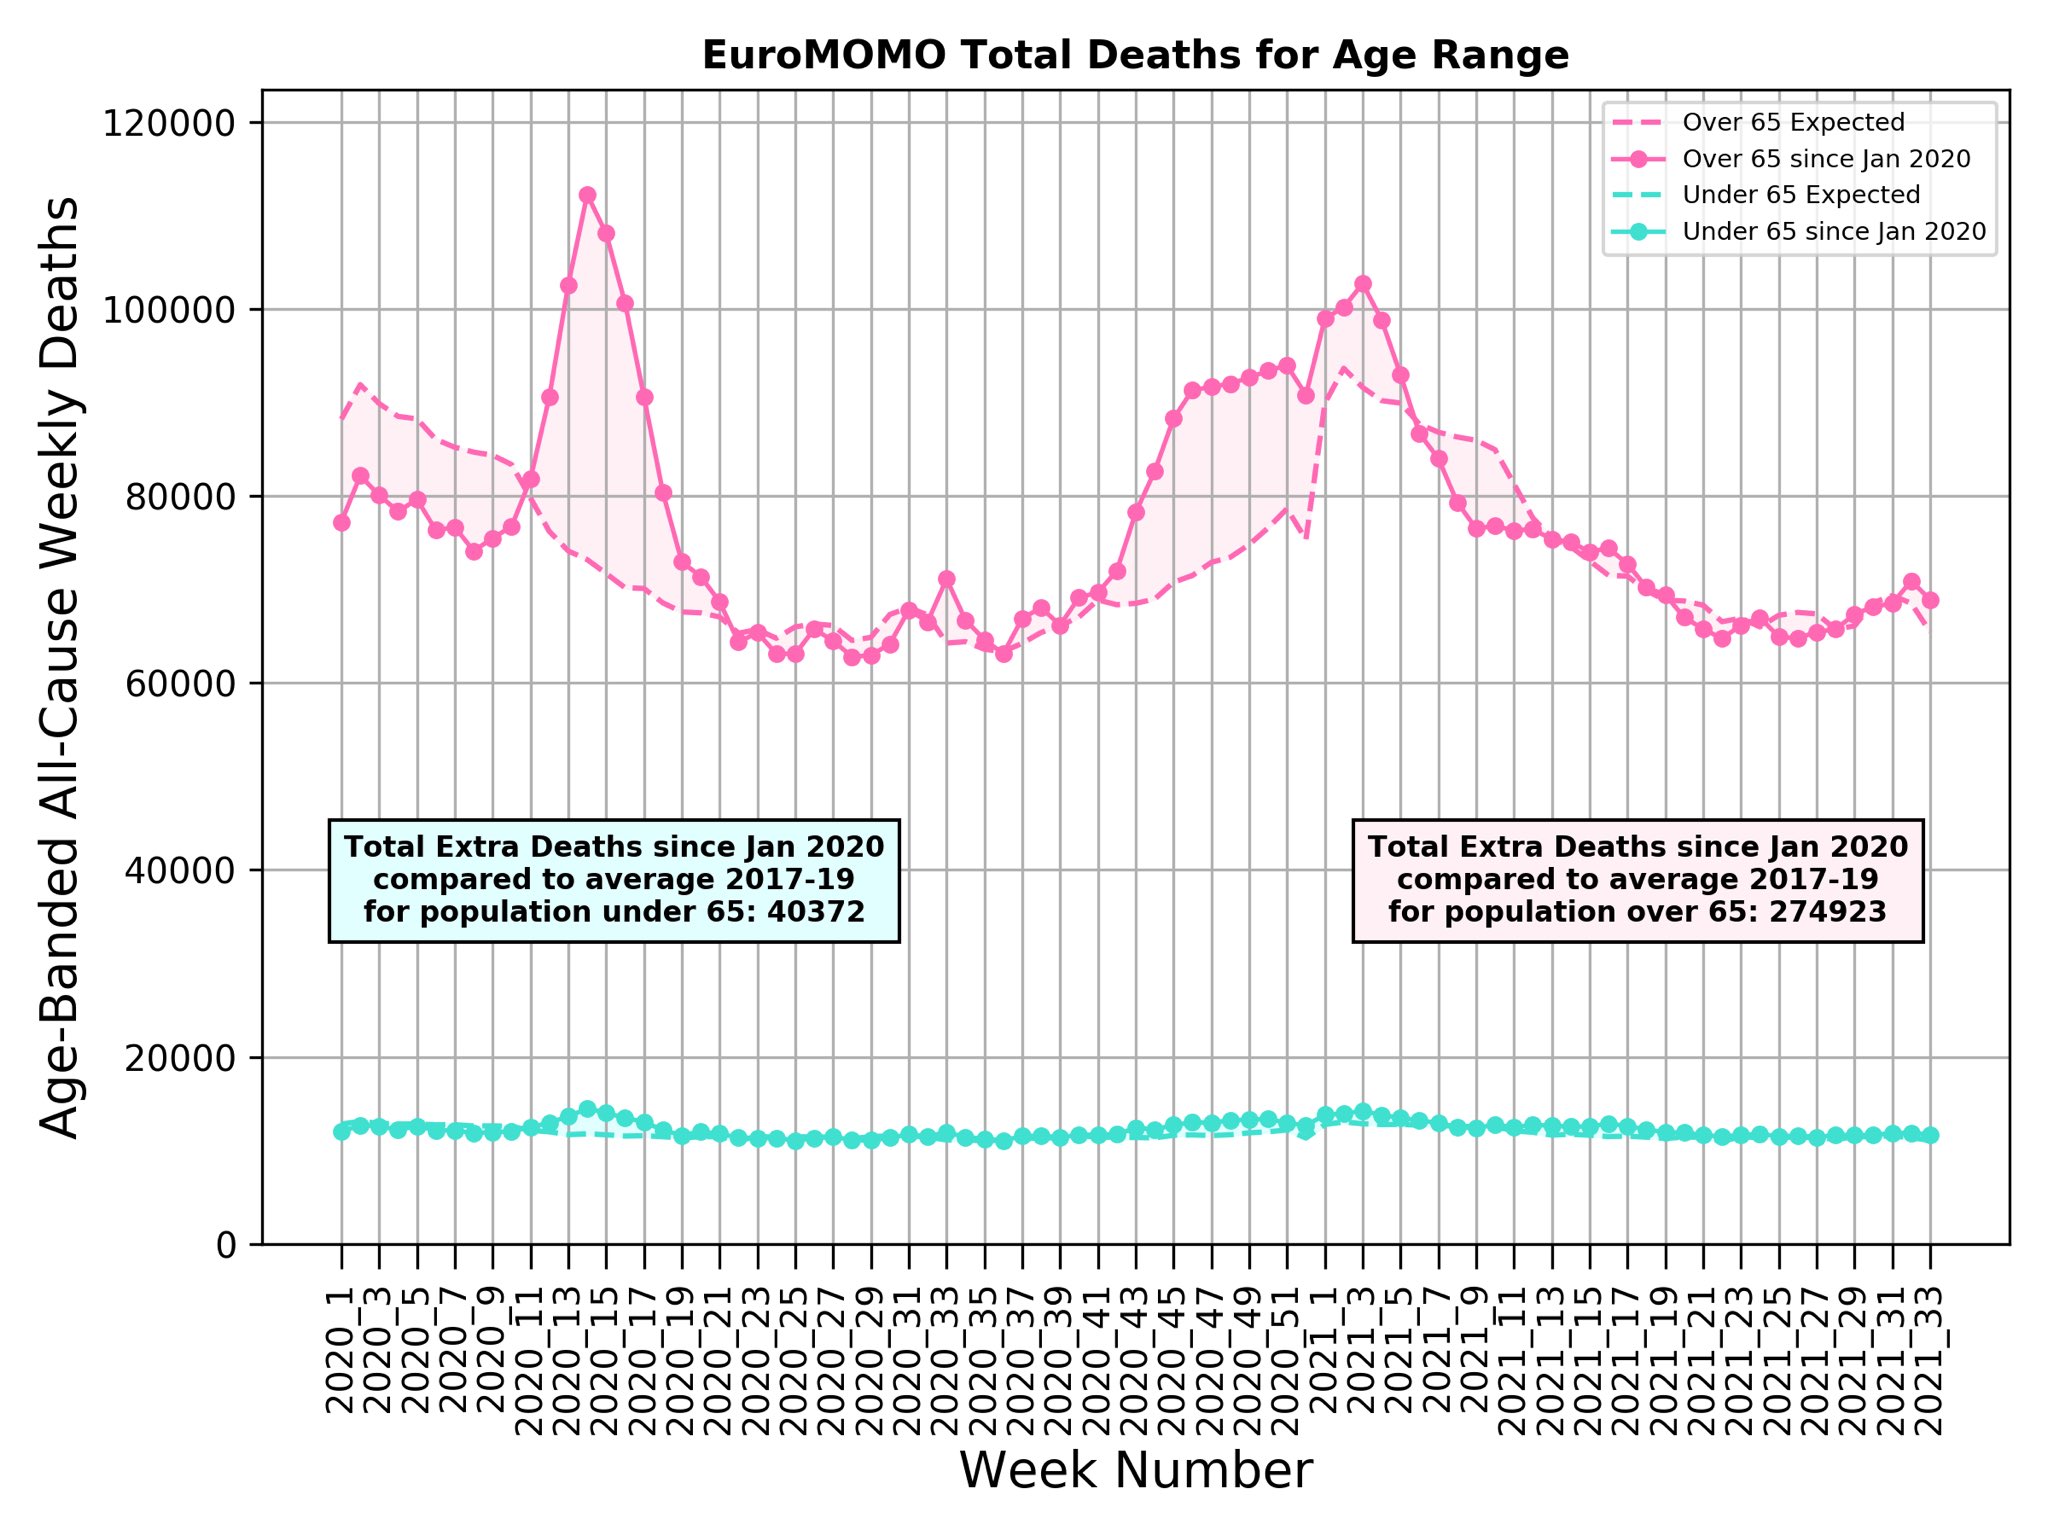
For under-65 year olds, recent Delta wave causes high excess death in USA but not in Europe (includes UK)?
Since 2020_14, baseline for under-65 year olds in the USA is up by ~15%, but is normal in UK & EU.
Why are young people in the US so vulnerable compared to old people?”
May 17
"Under/over reported?
Can excess distinguish?
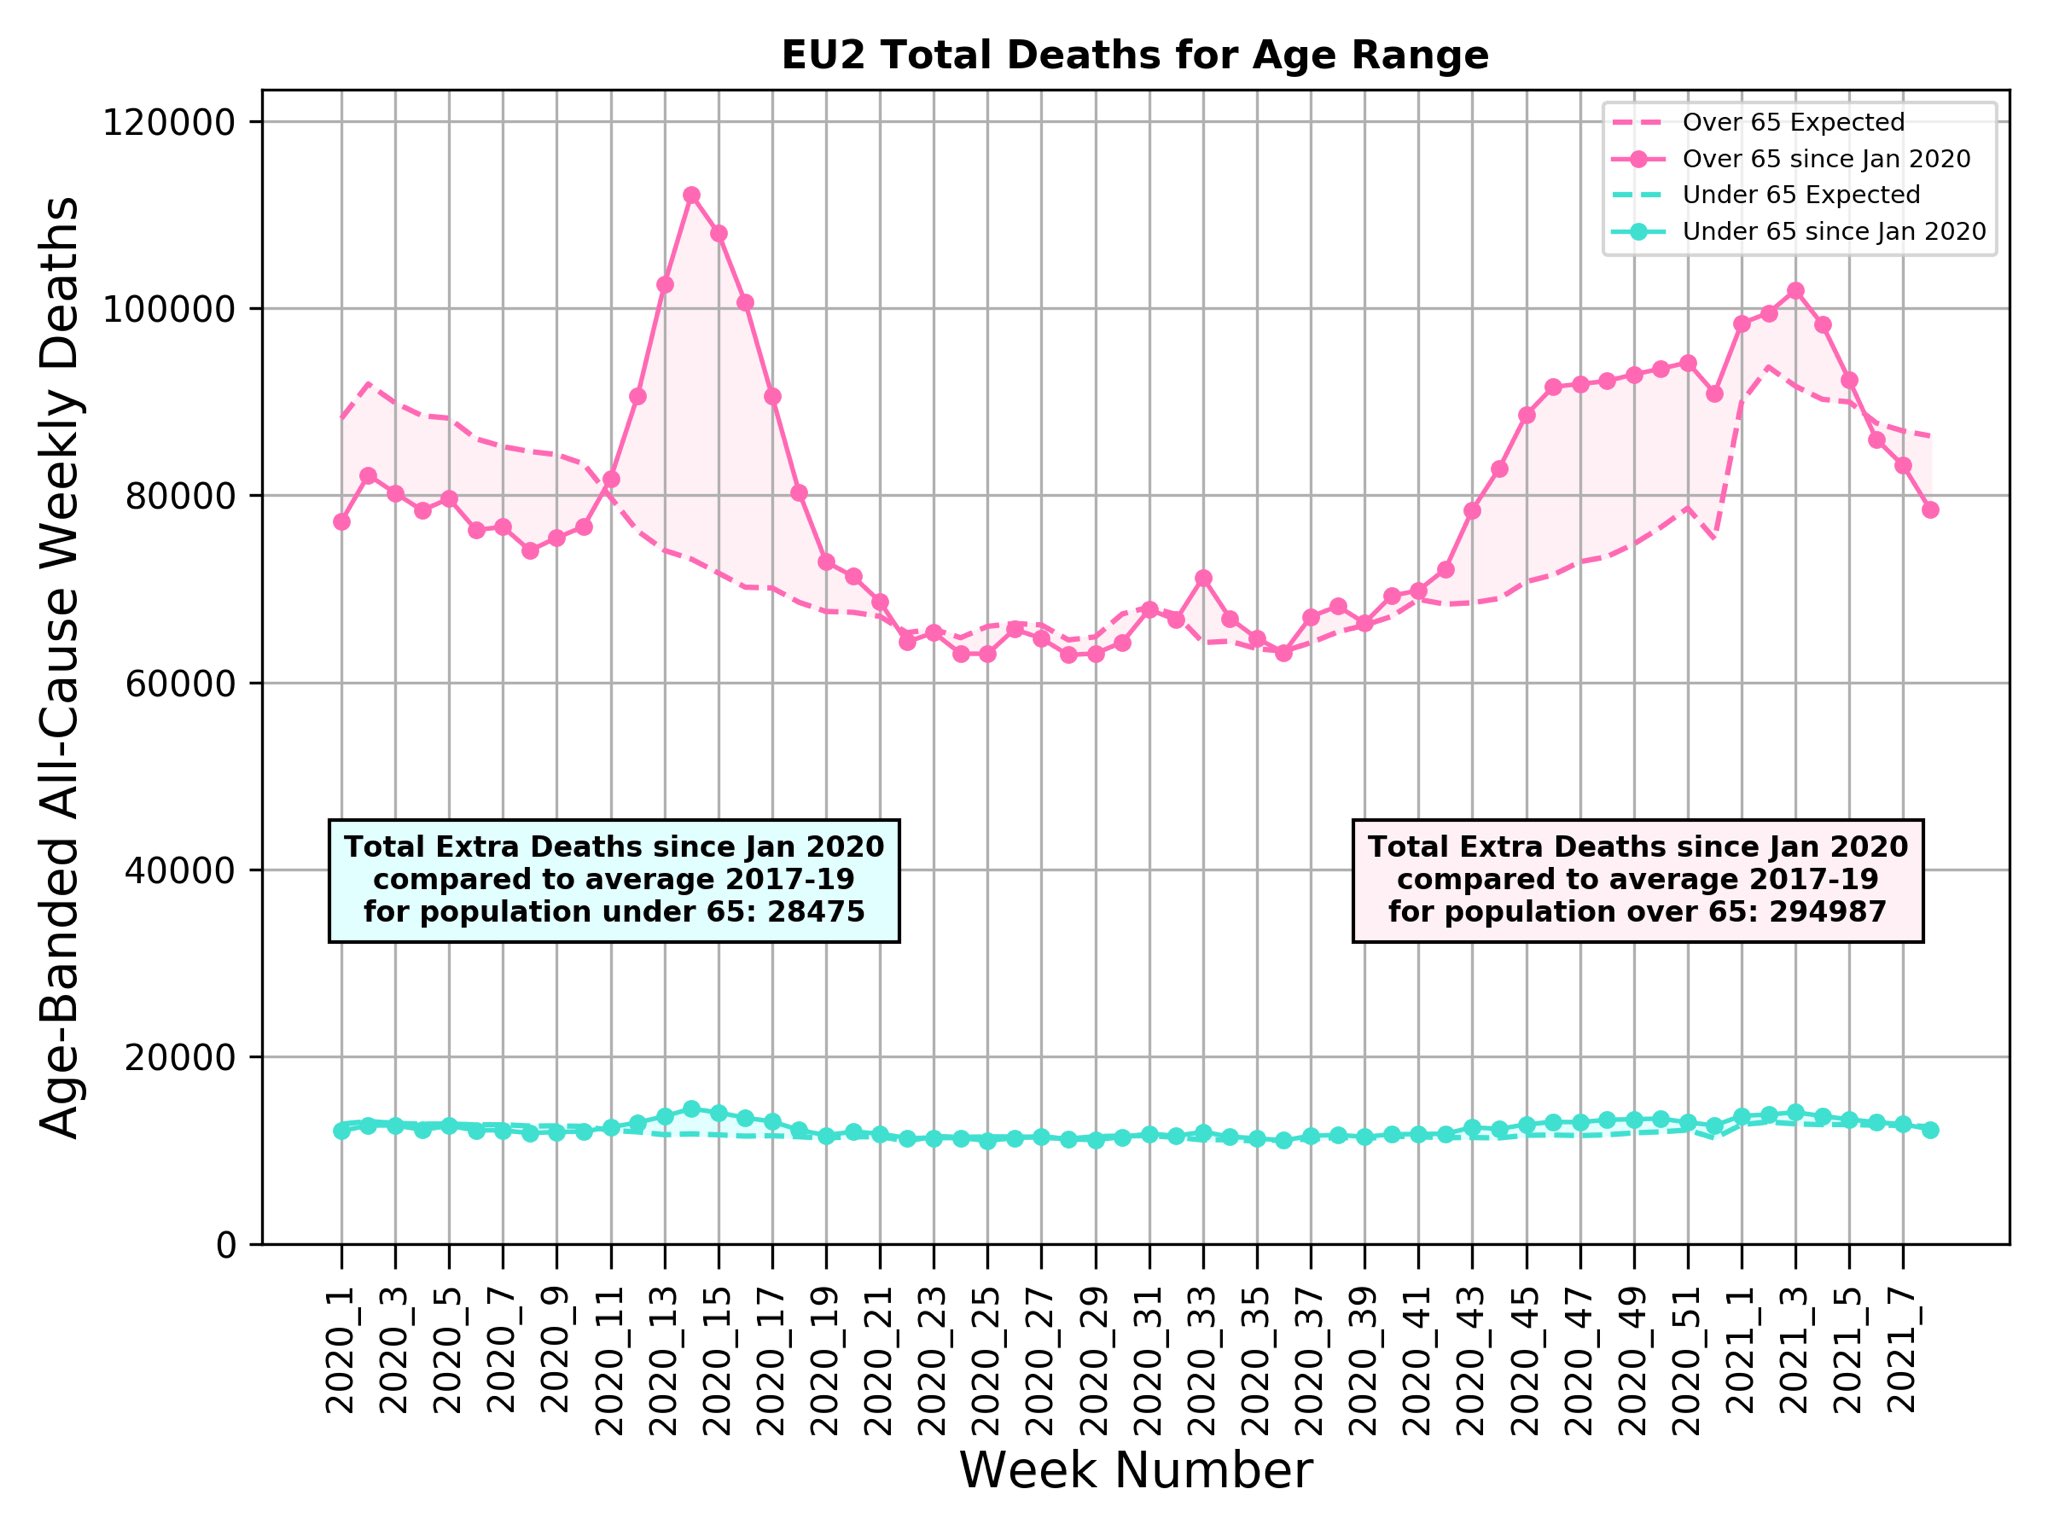
US & EU excess all-cause deaths to mid Mar-21 complete. On 15-Mar, reported COVID-19 deaths were ~530K in US & EU.
From plots excess:
US 160K+360K=520K;
EU 28K+285K=313K.
US excess = reported.
EU excess 40% less.
Which is correct?""
from TWEET: 22 DEC 2021
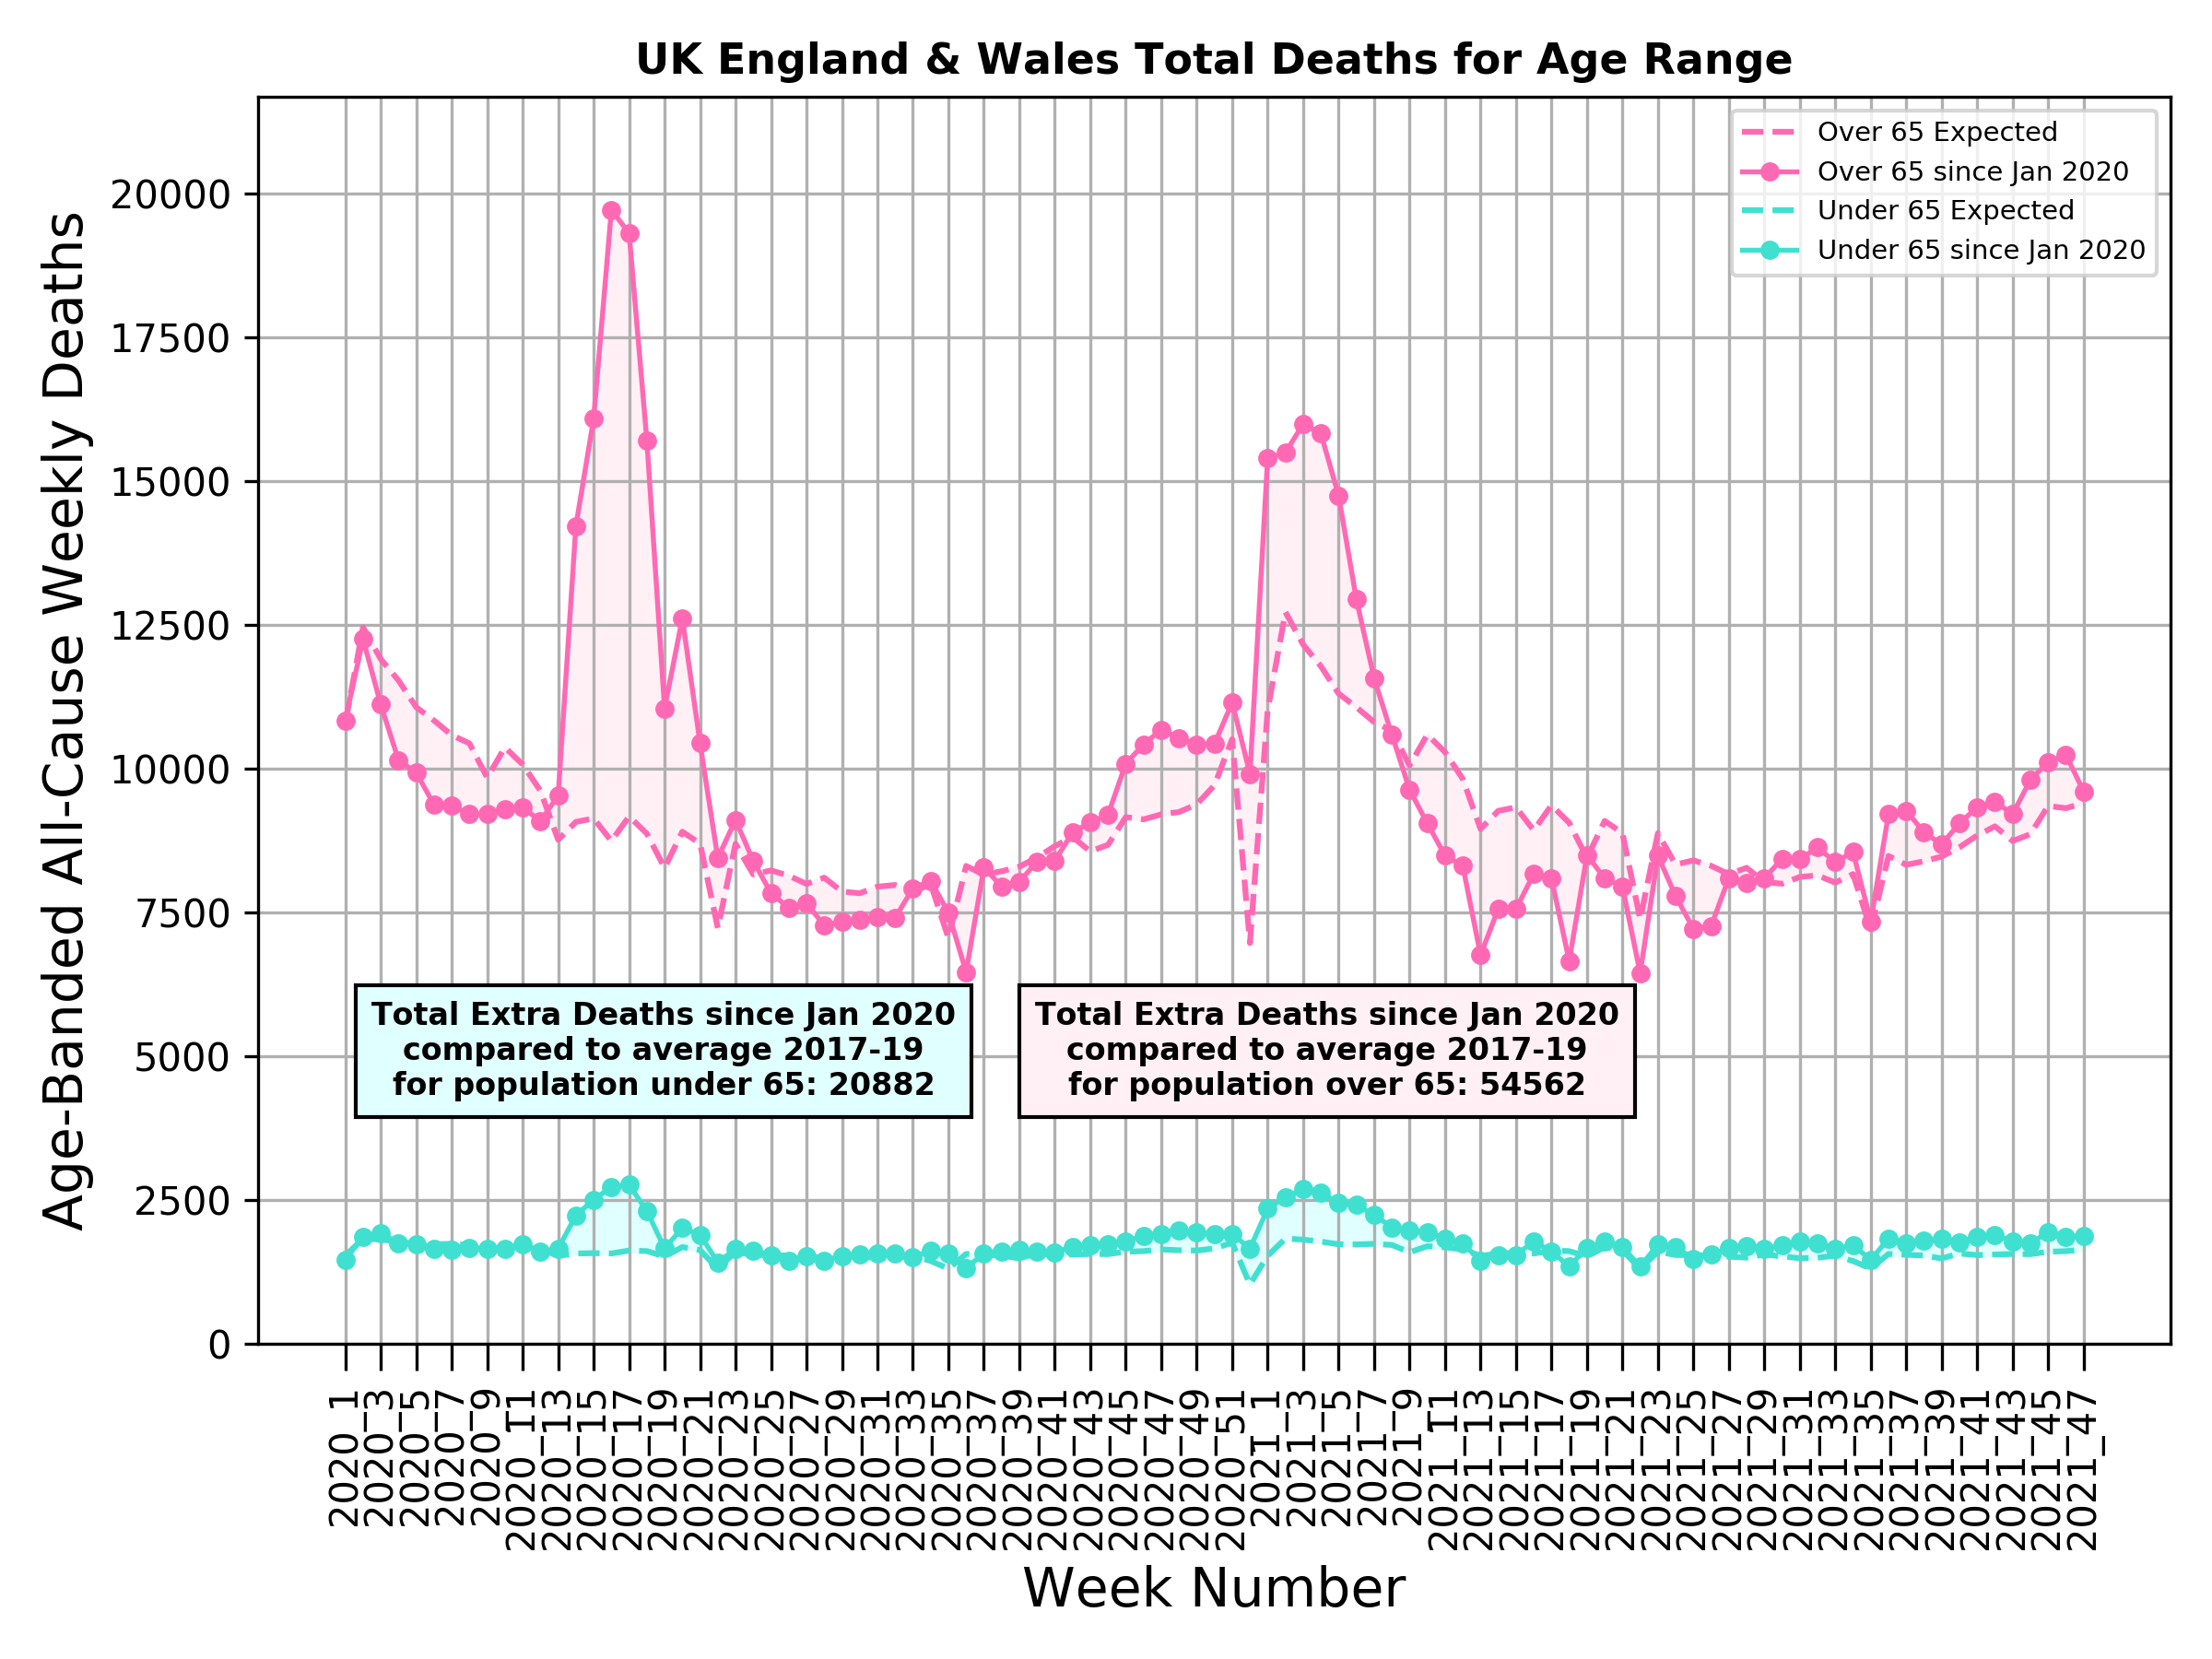
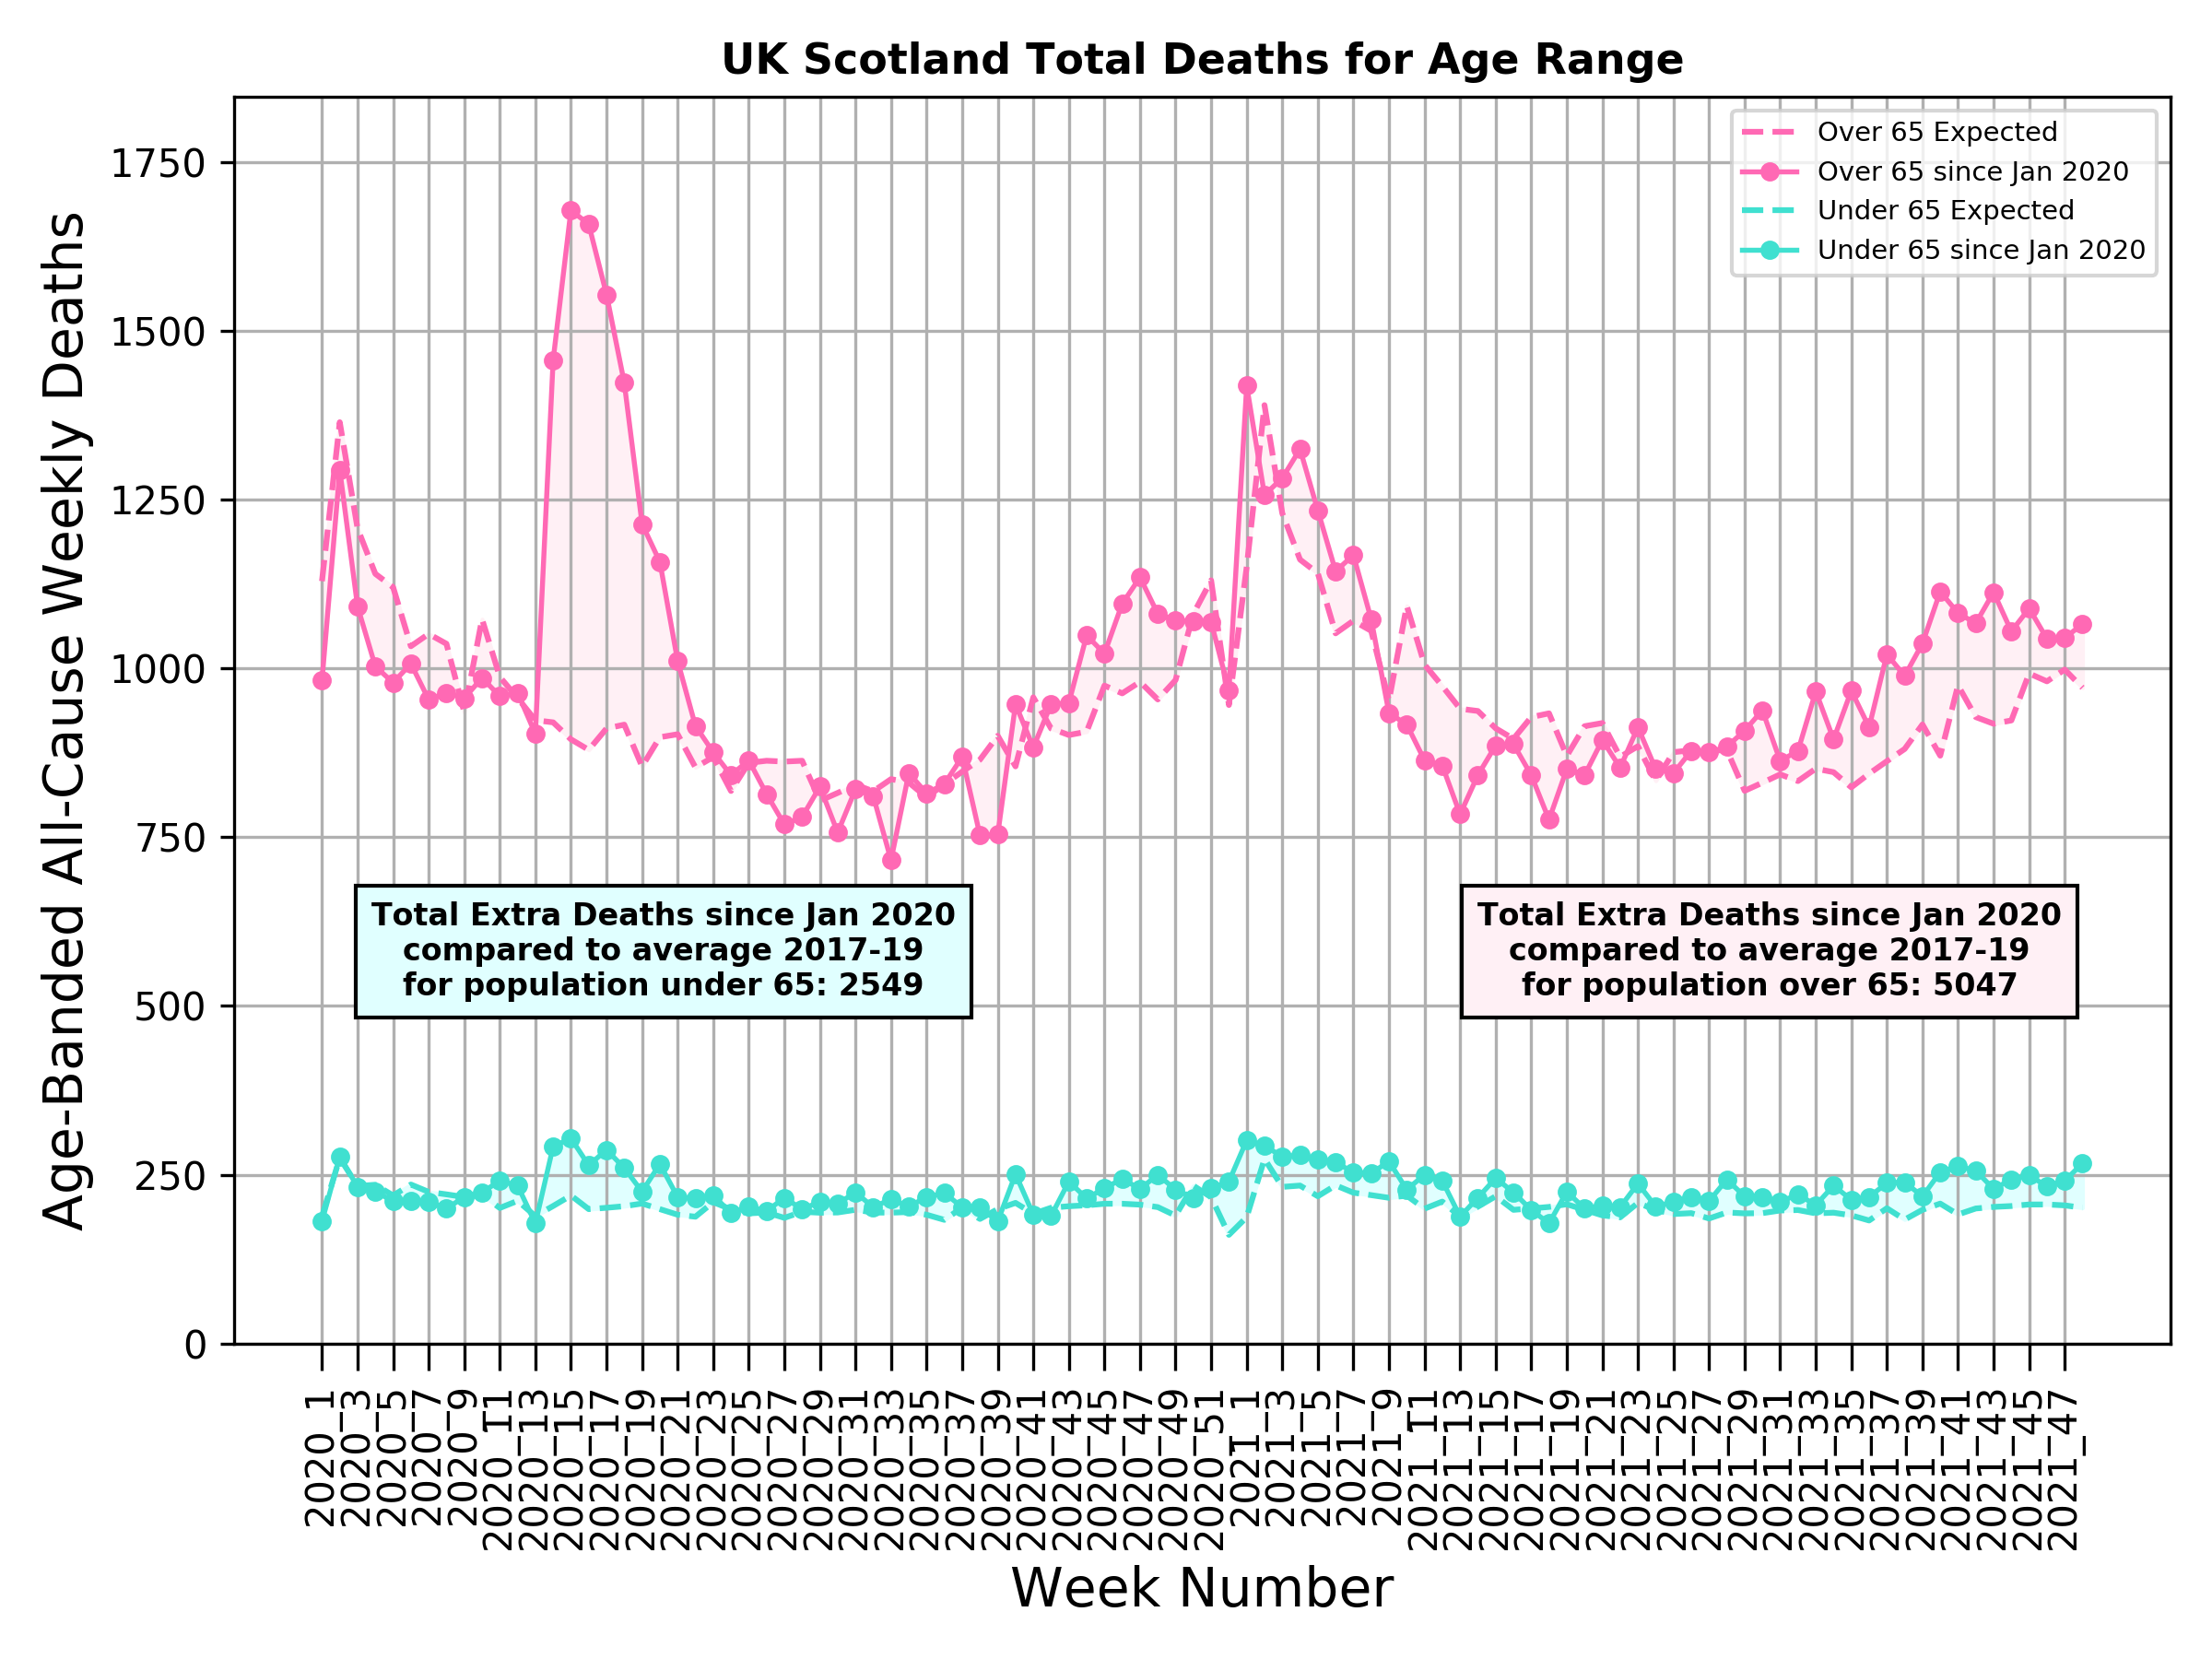
“In England & Wales (ENW, most of UK), there have been zero excess deaths in the 44 weeks since 1-Feb-2021. In that same period to 22-Nov-2021, there were 1.47 million cases COVID-19. If we add Scotland & Northern Ireland to ENW the start of the period is a bit later on 5-Feb.”
Week 47 2021 (28 Nov)
UK: Scotland
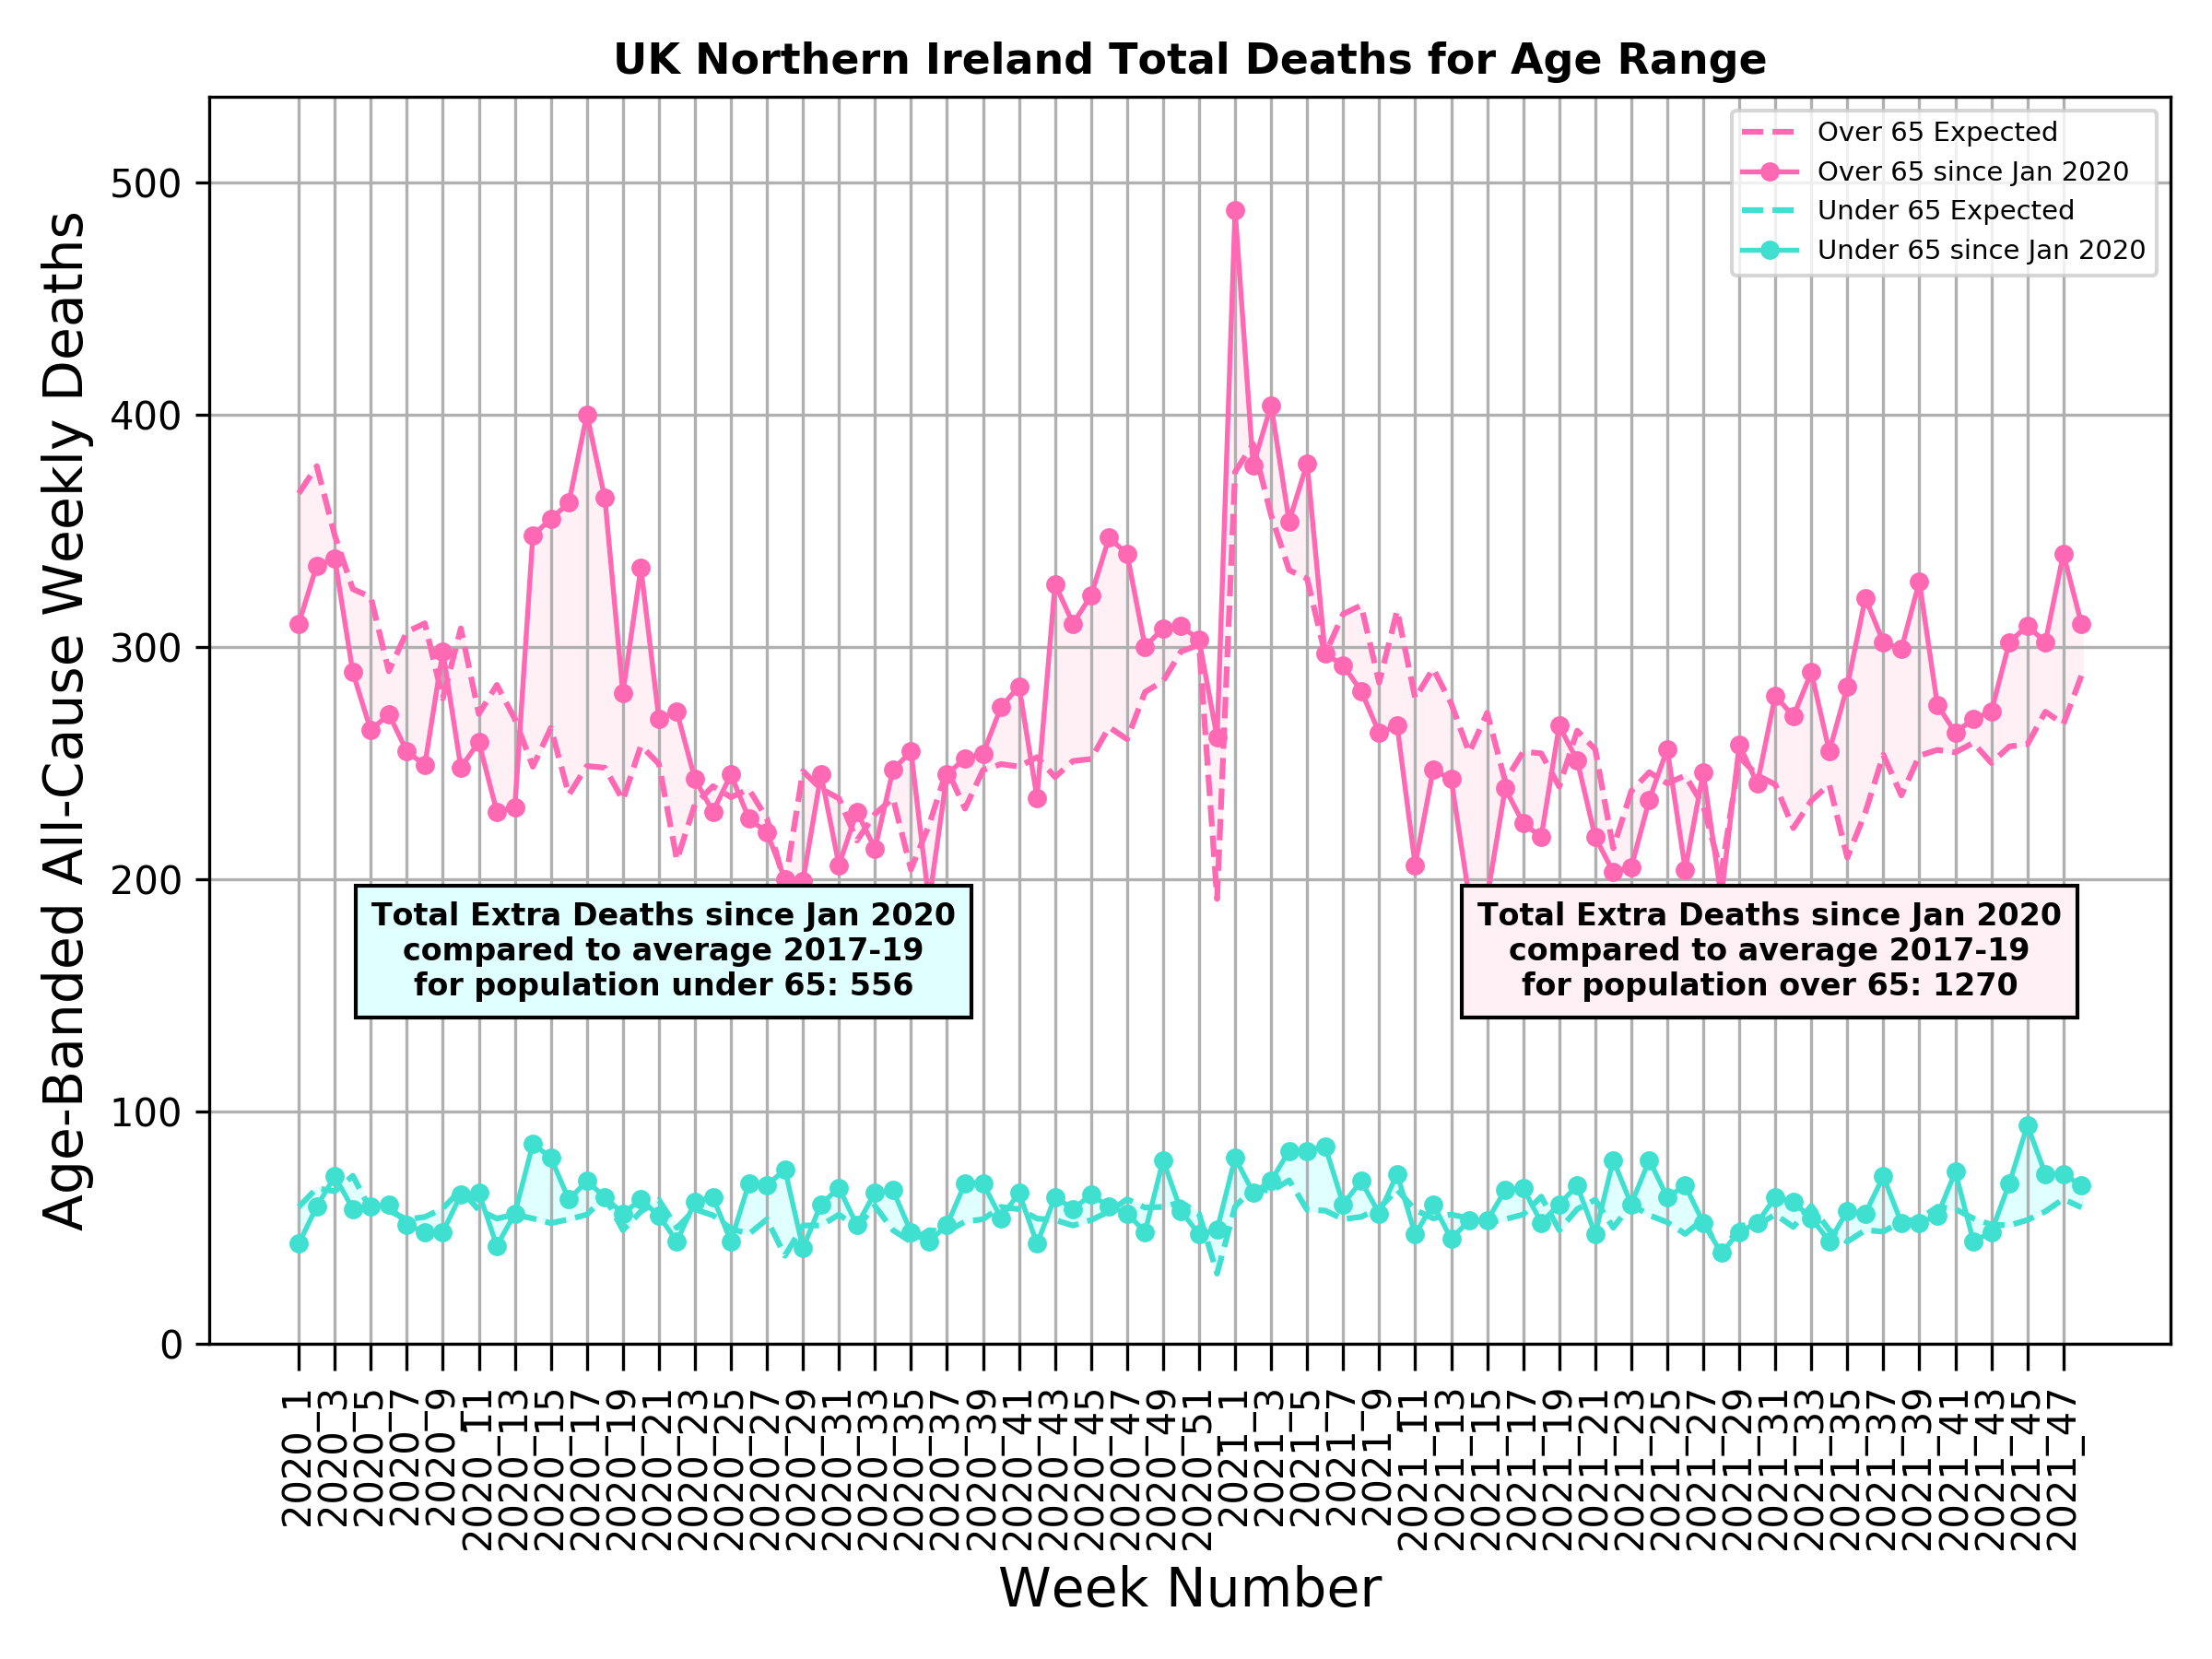
Week 48 2021 (5 Dec)
UK: Northern Ireland
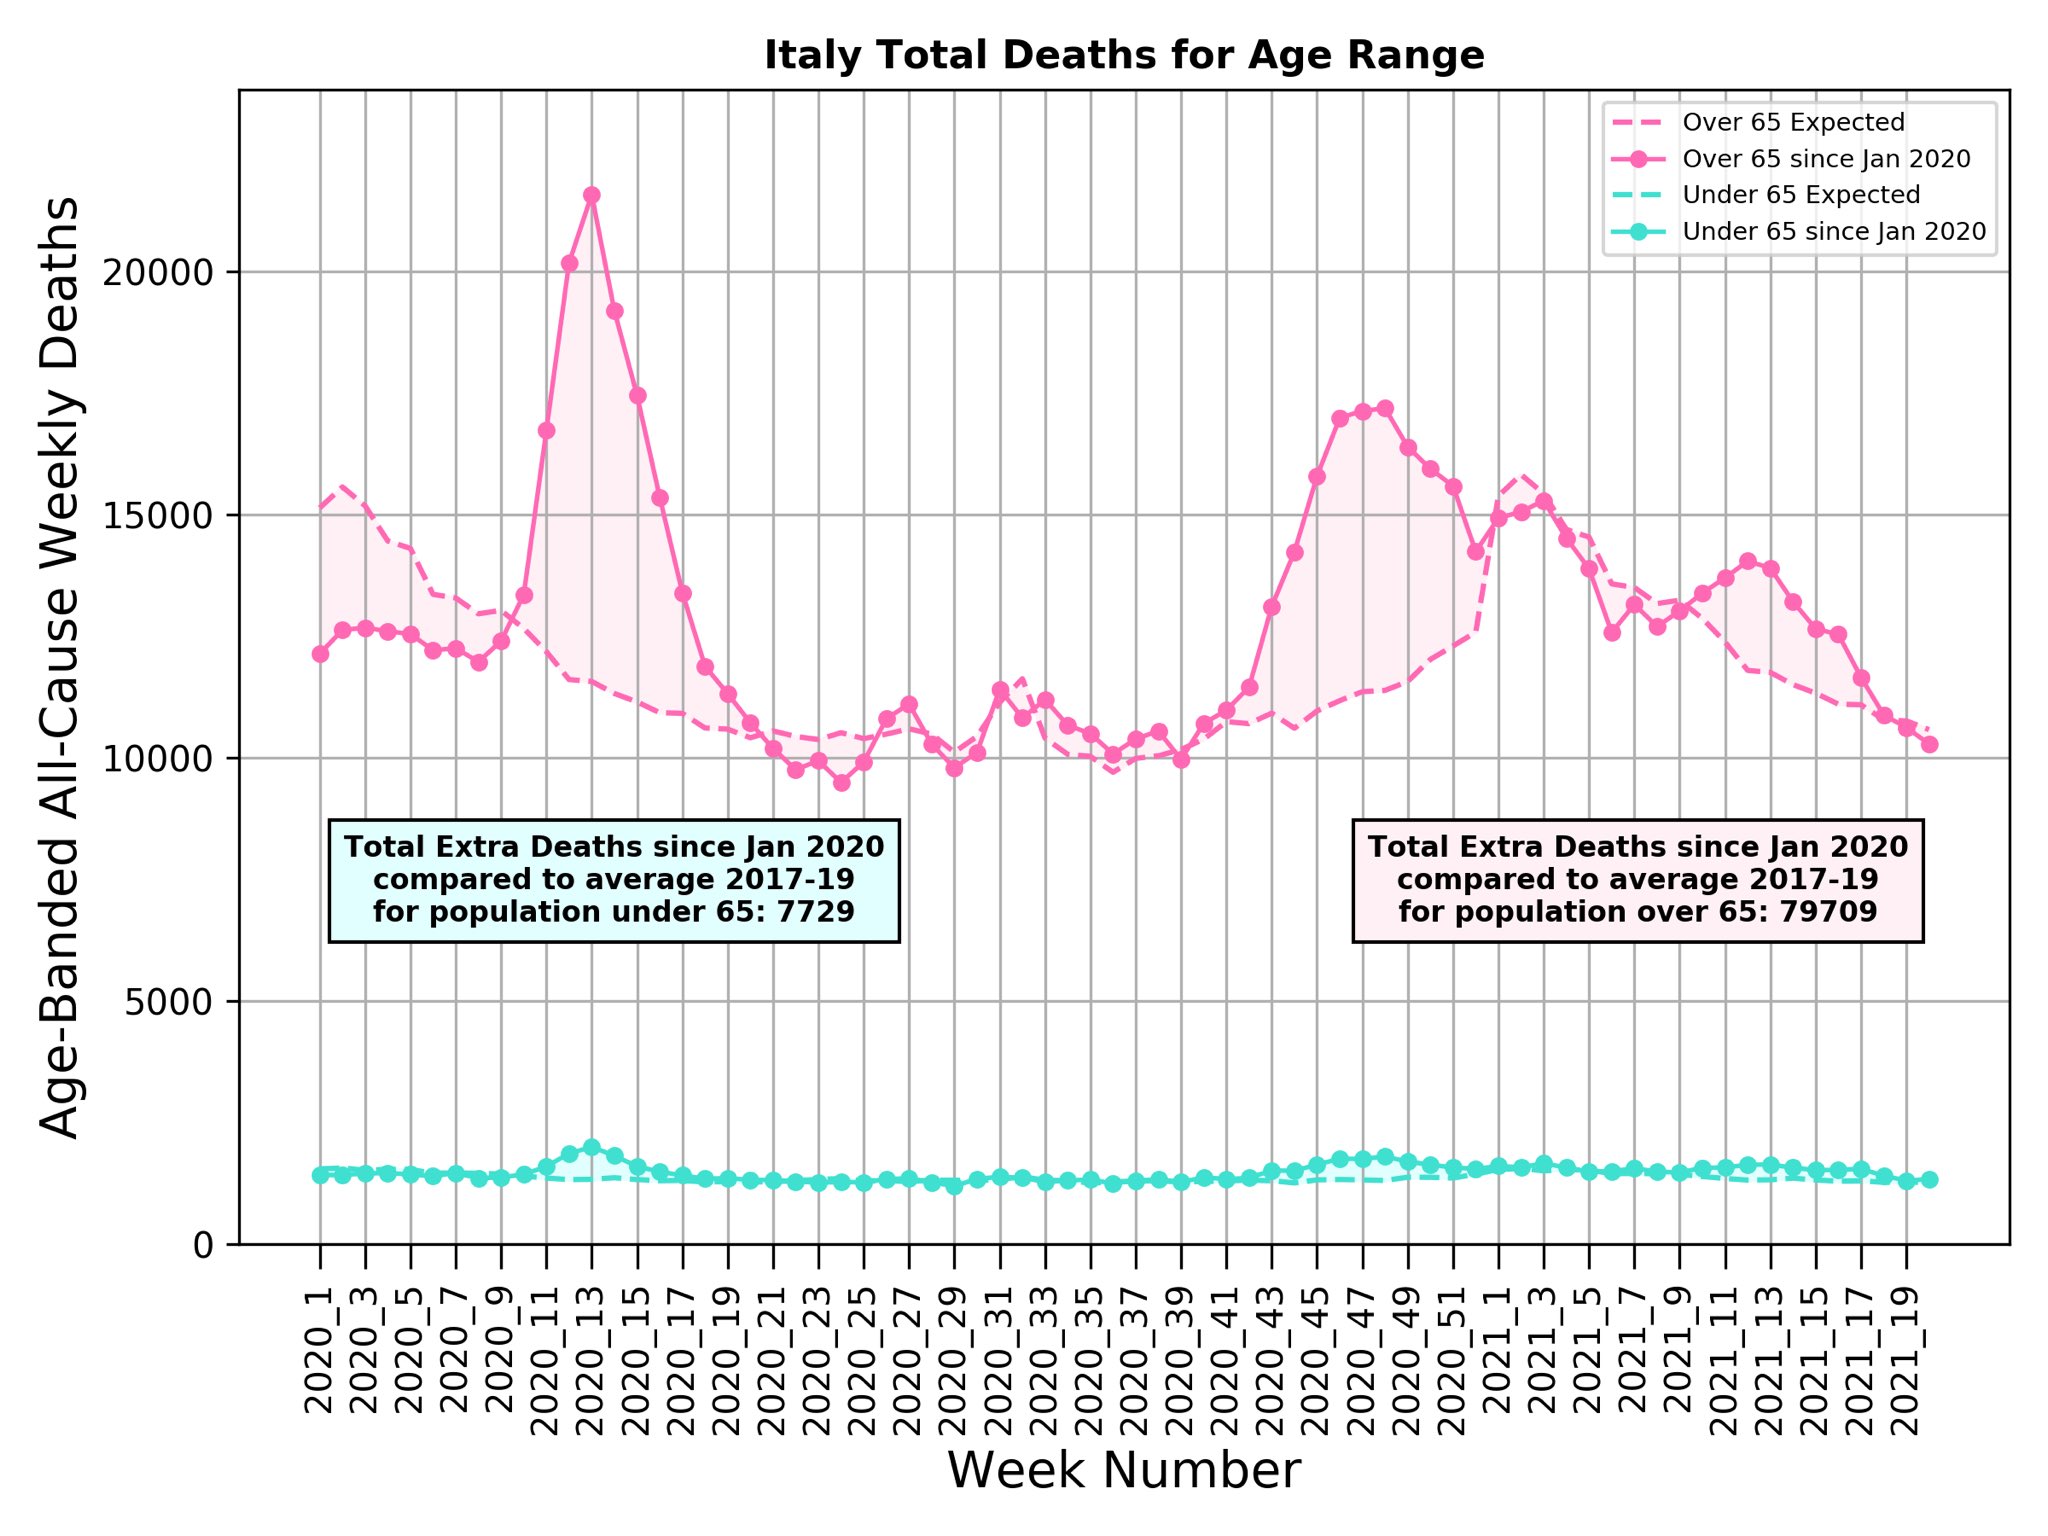
Week 48 2021 (5 Dec)
ITALY
ITALY Aug 19
“Zero COVID-19 lethality < 60 seems surprising. Please share link.
Sanity check shows almost true.
*Total is 127K.
*Excess death is 7,739 < 65 matching your deaths < 70.
Just 5% deaths < 60 may be true for west Europe.
Why do the young panic for a disease affecting the old?”
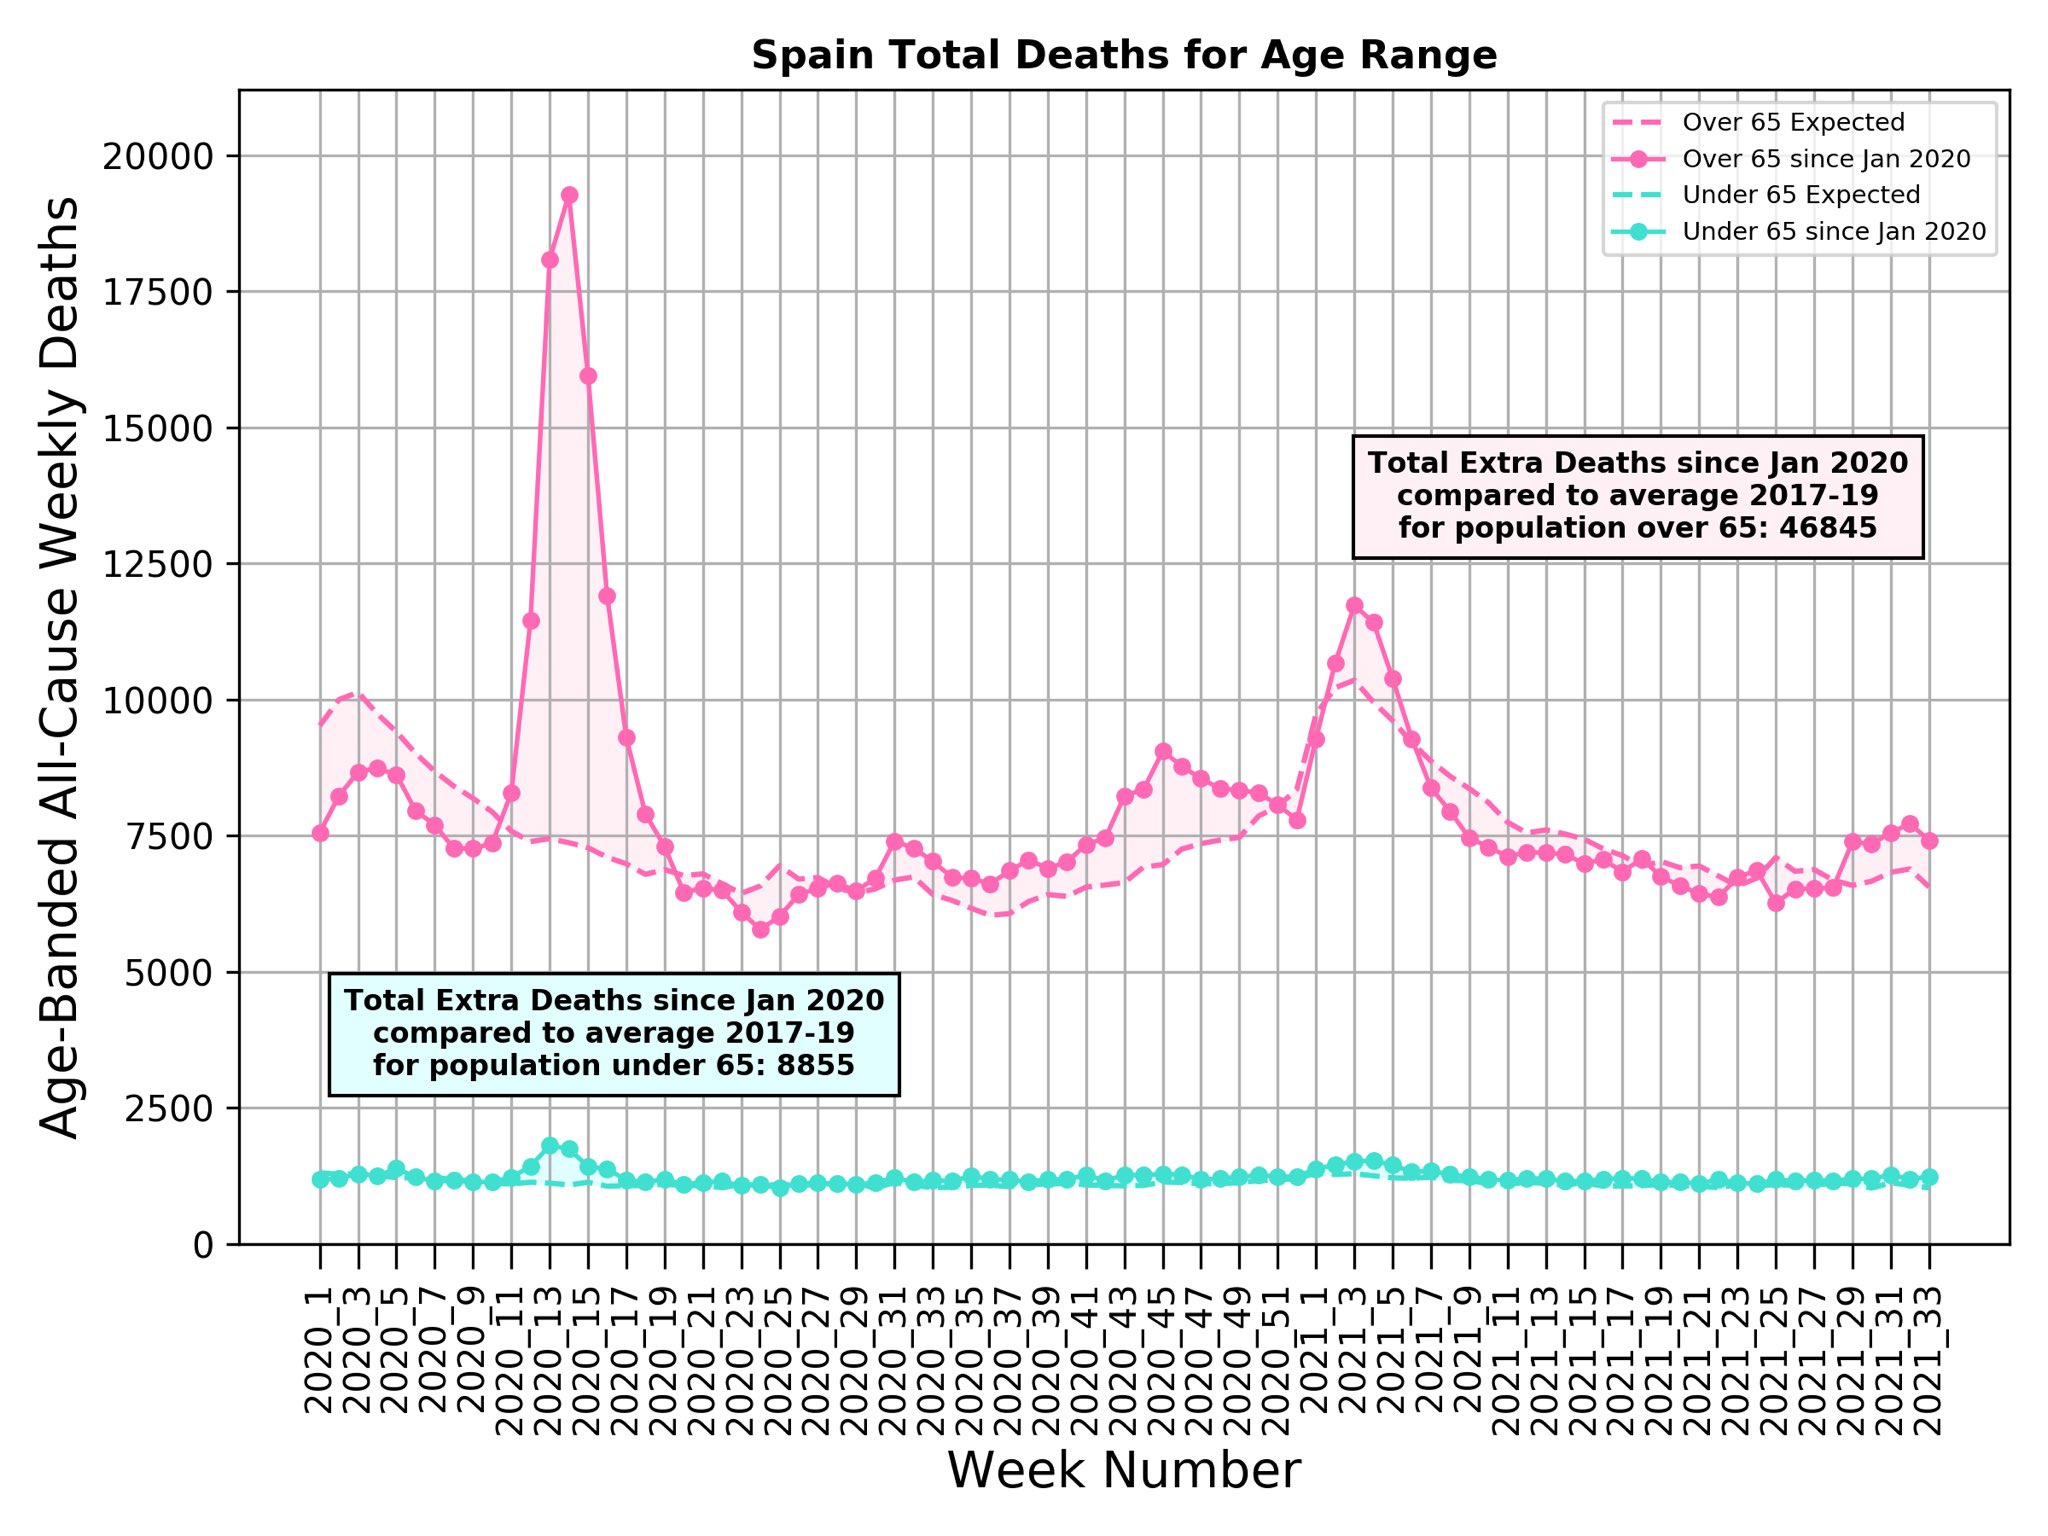
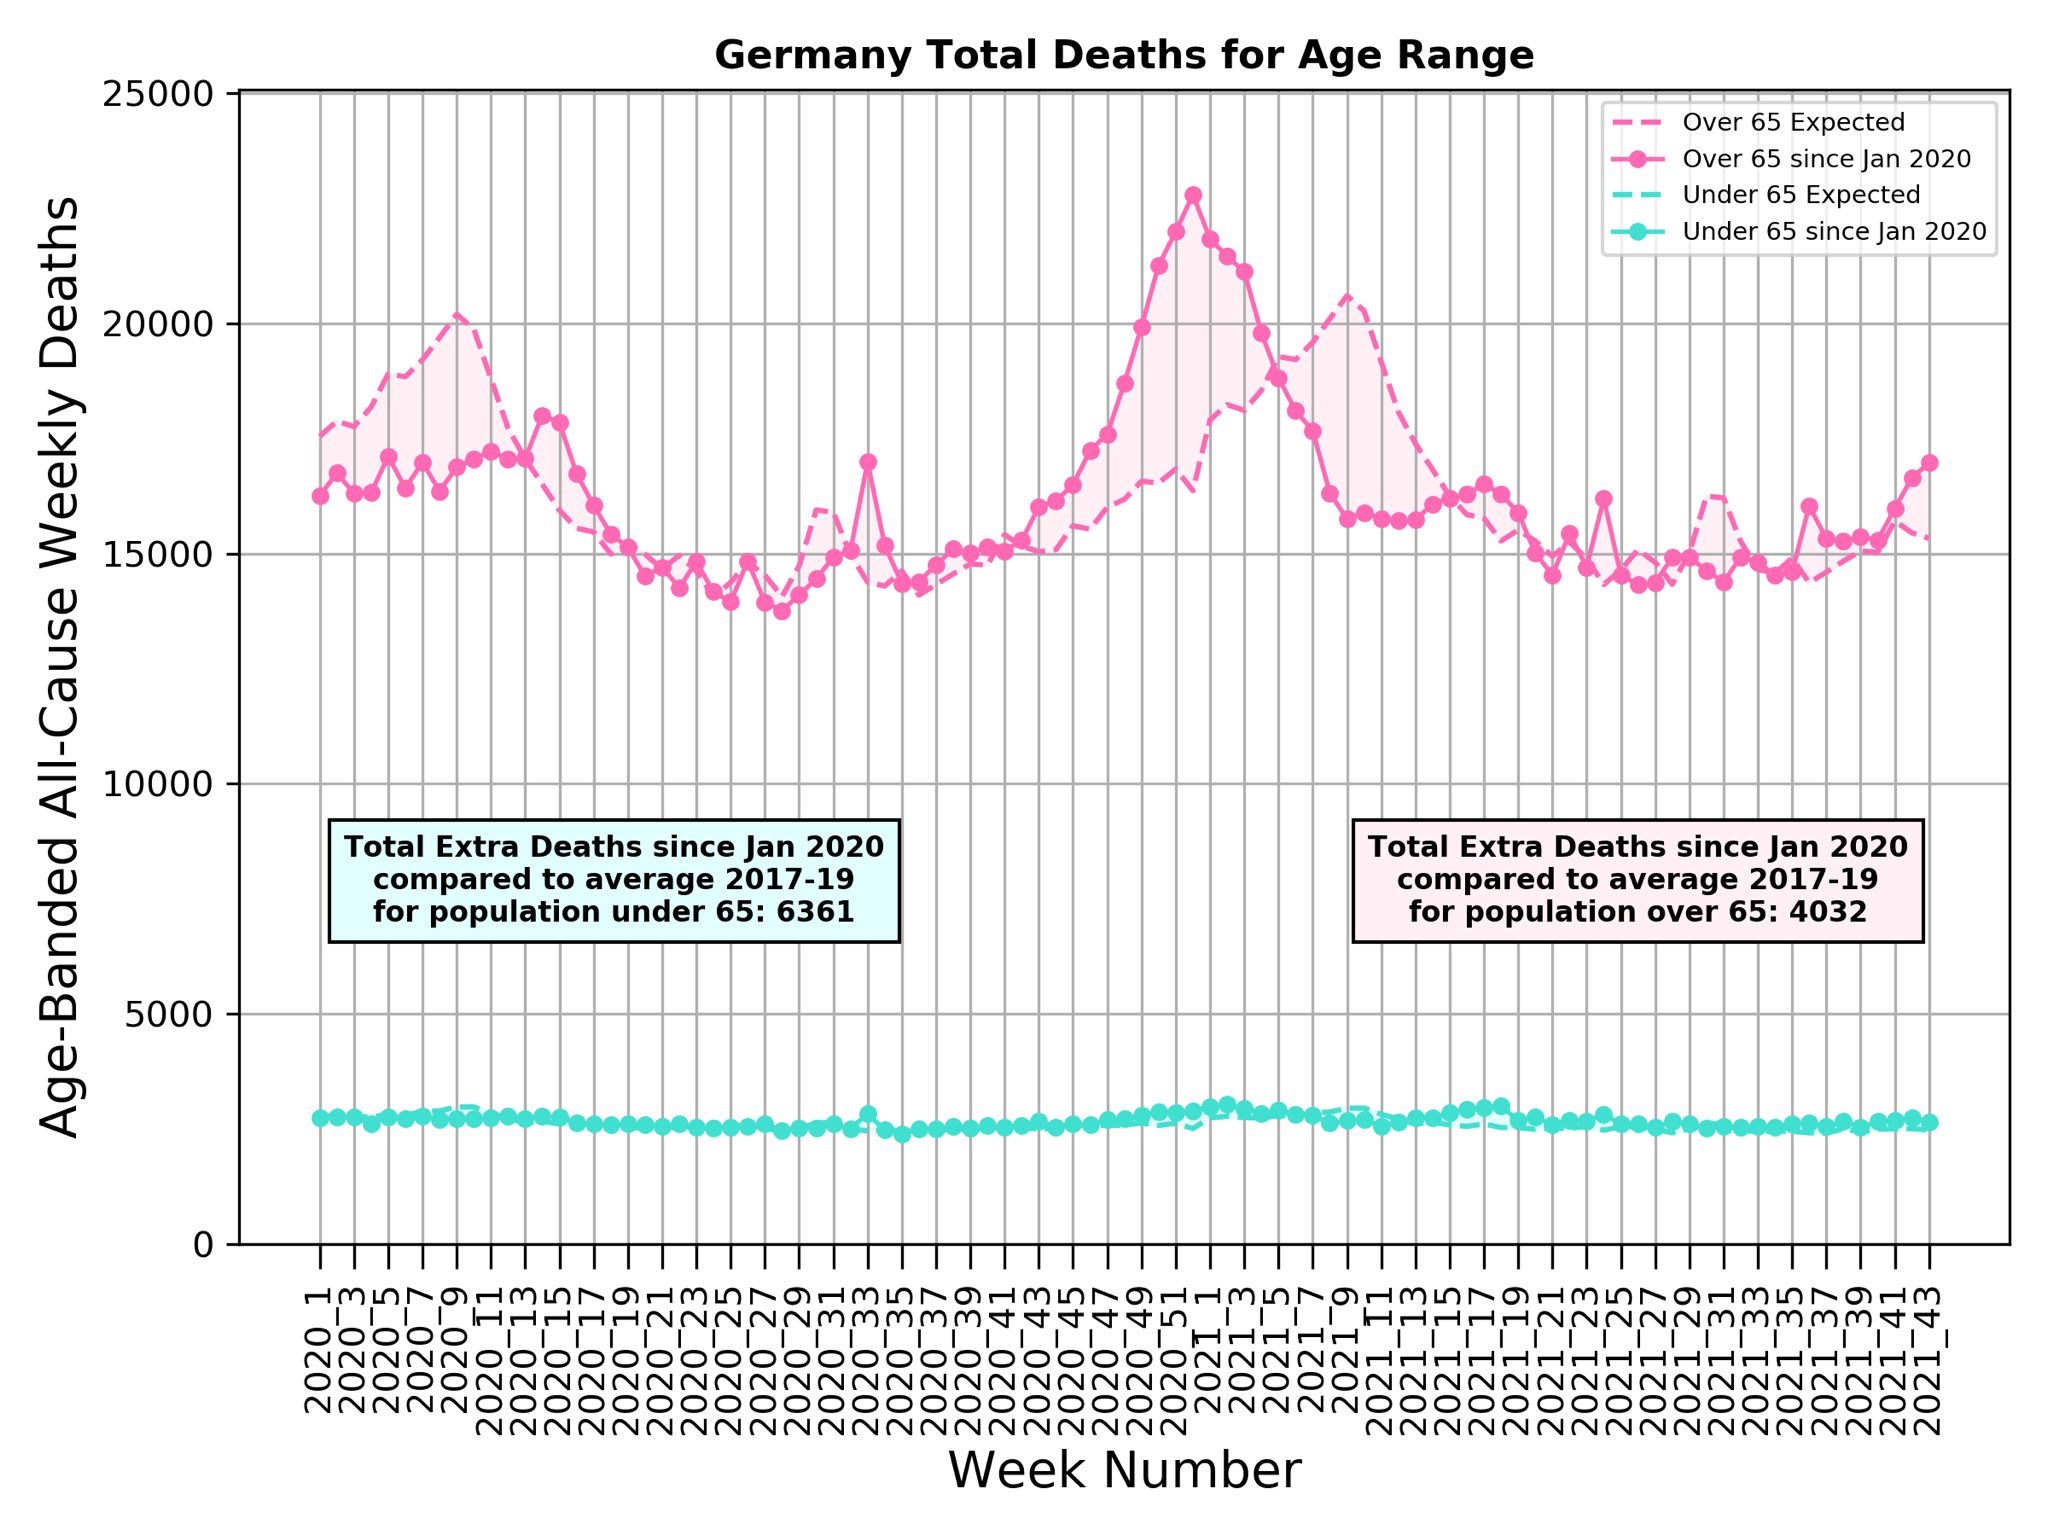
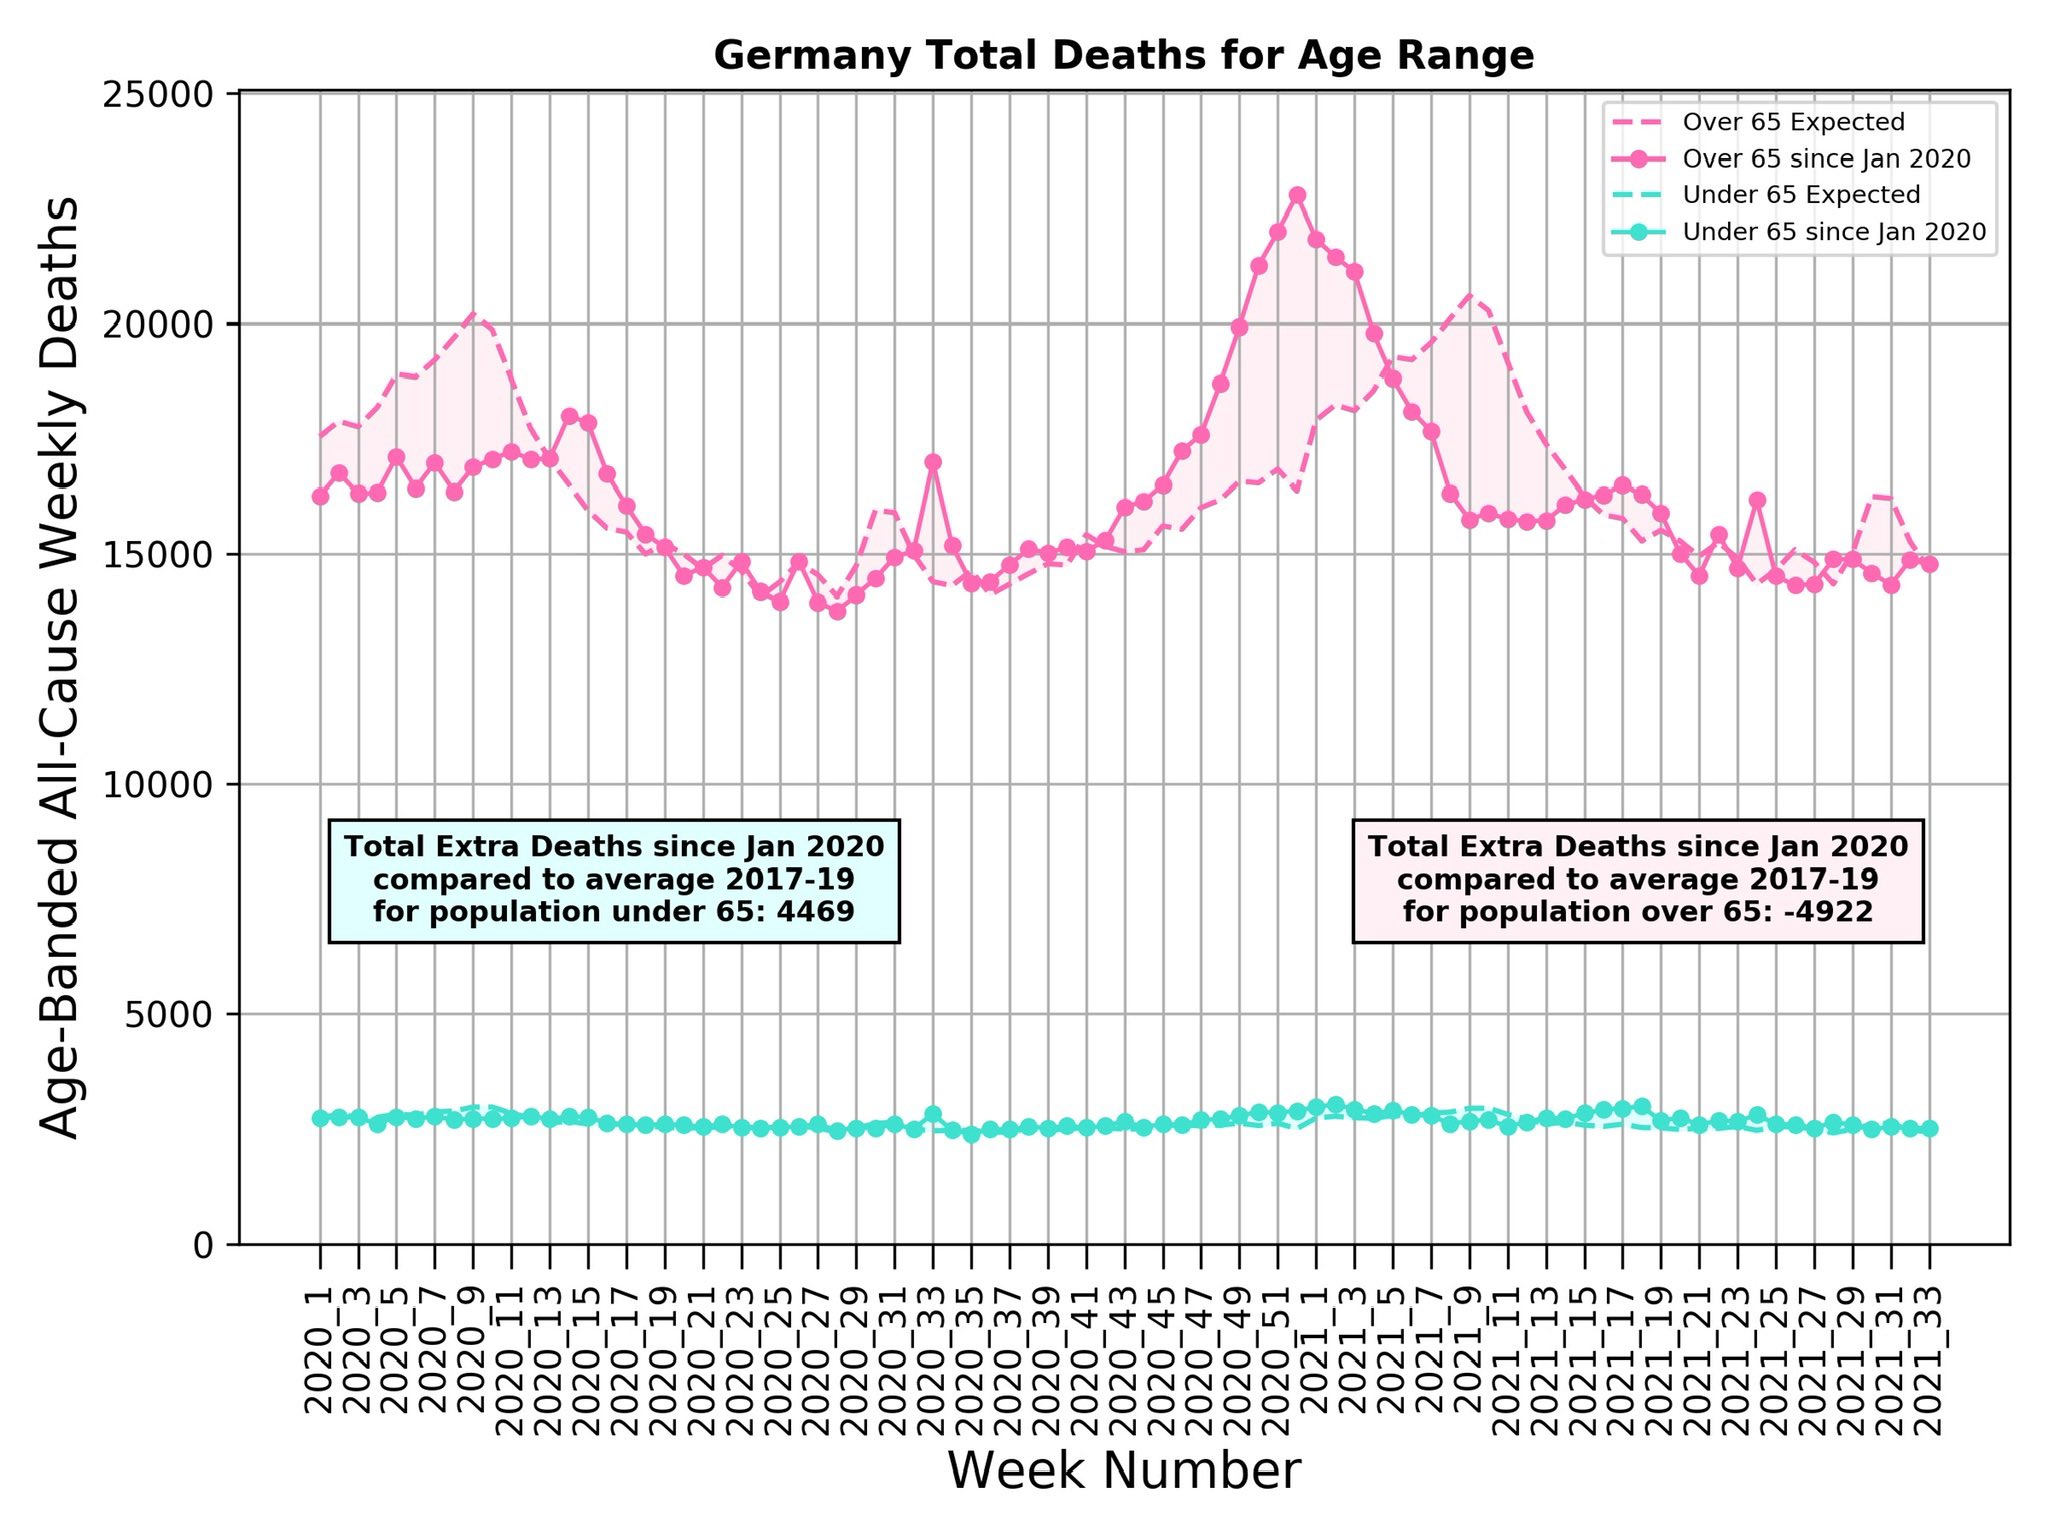
“Excess death in Austria & Germany is low to week 43 (30 October 2021). Still in both places there a small but worrying increase over the past two weeks.
Meanwhile excess death in Sweden is less than expected & dropping week by week.”
"Germany & Sweden have very similar excess deaths profiles.
Could Germany have fared better than the other large European countries like Italy, Spain, France & UK because it has a less centralized population distribution?
In SWE & DEU, COVID-19 no worse than 2017-18 Influenza."
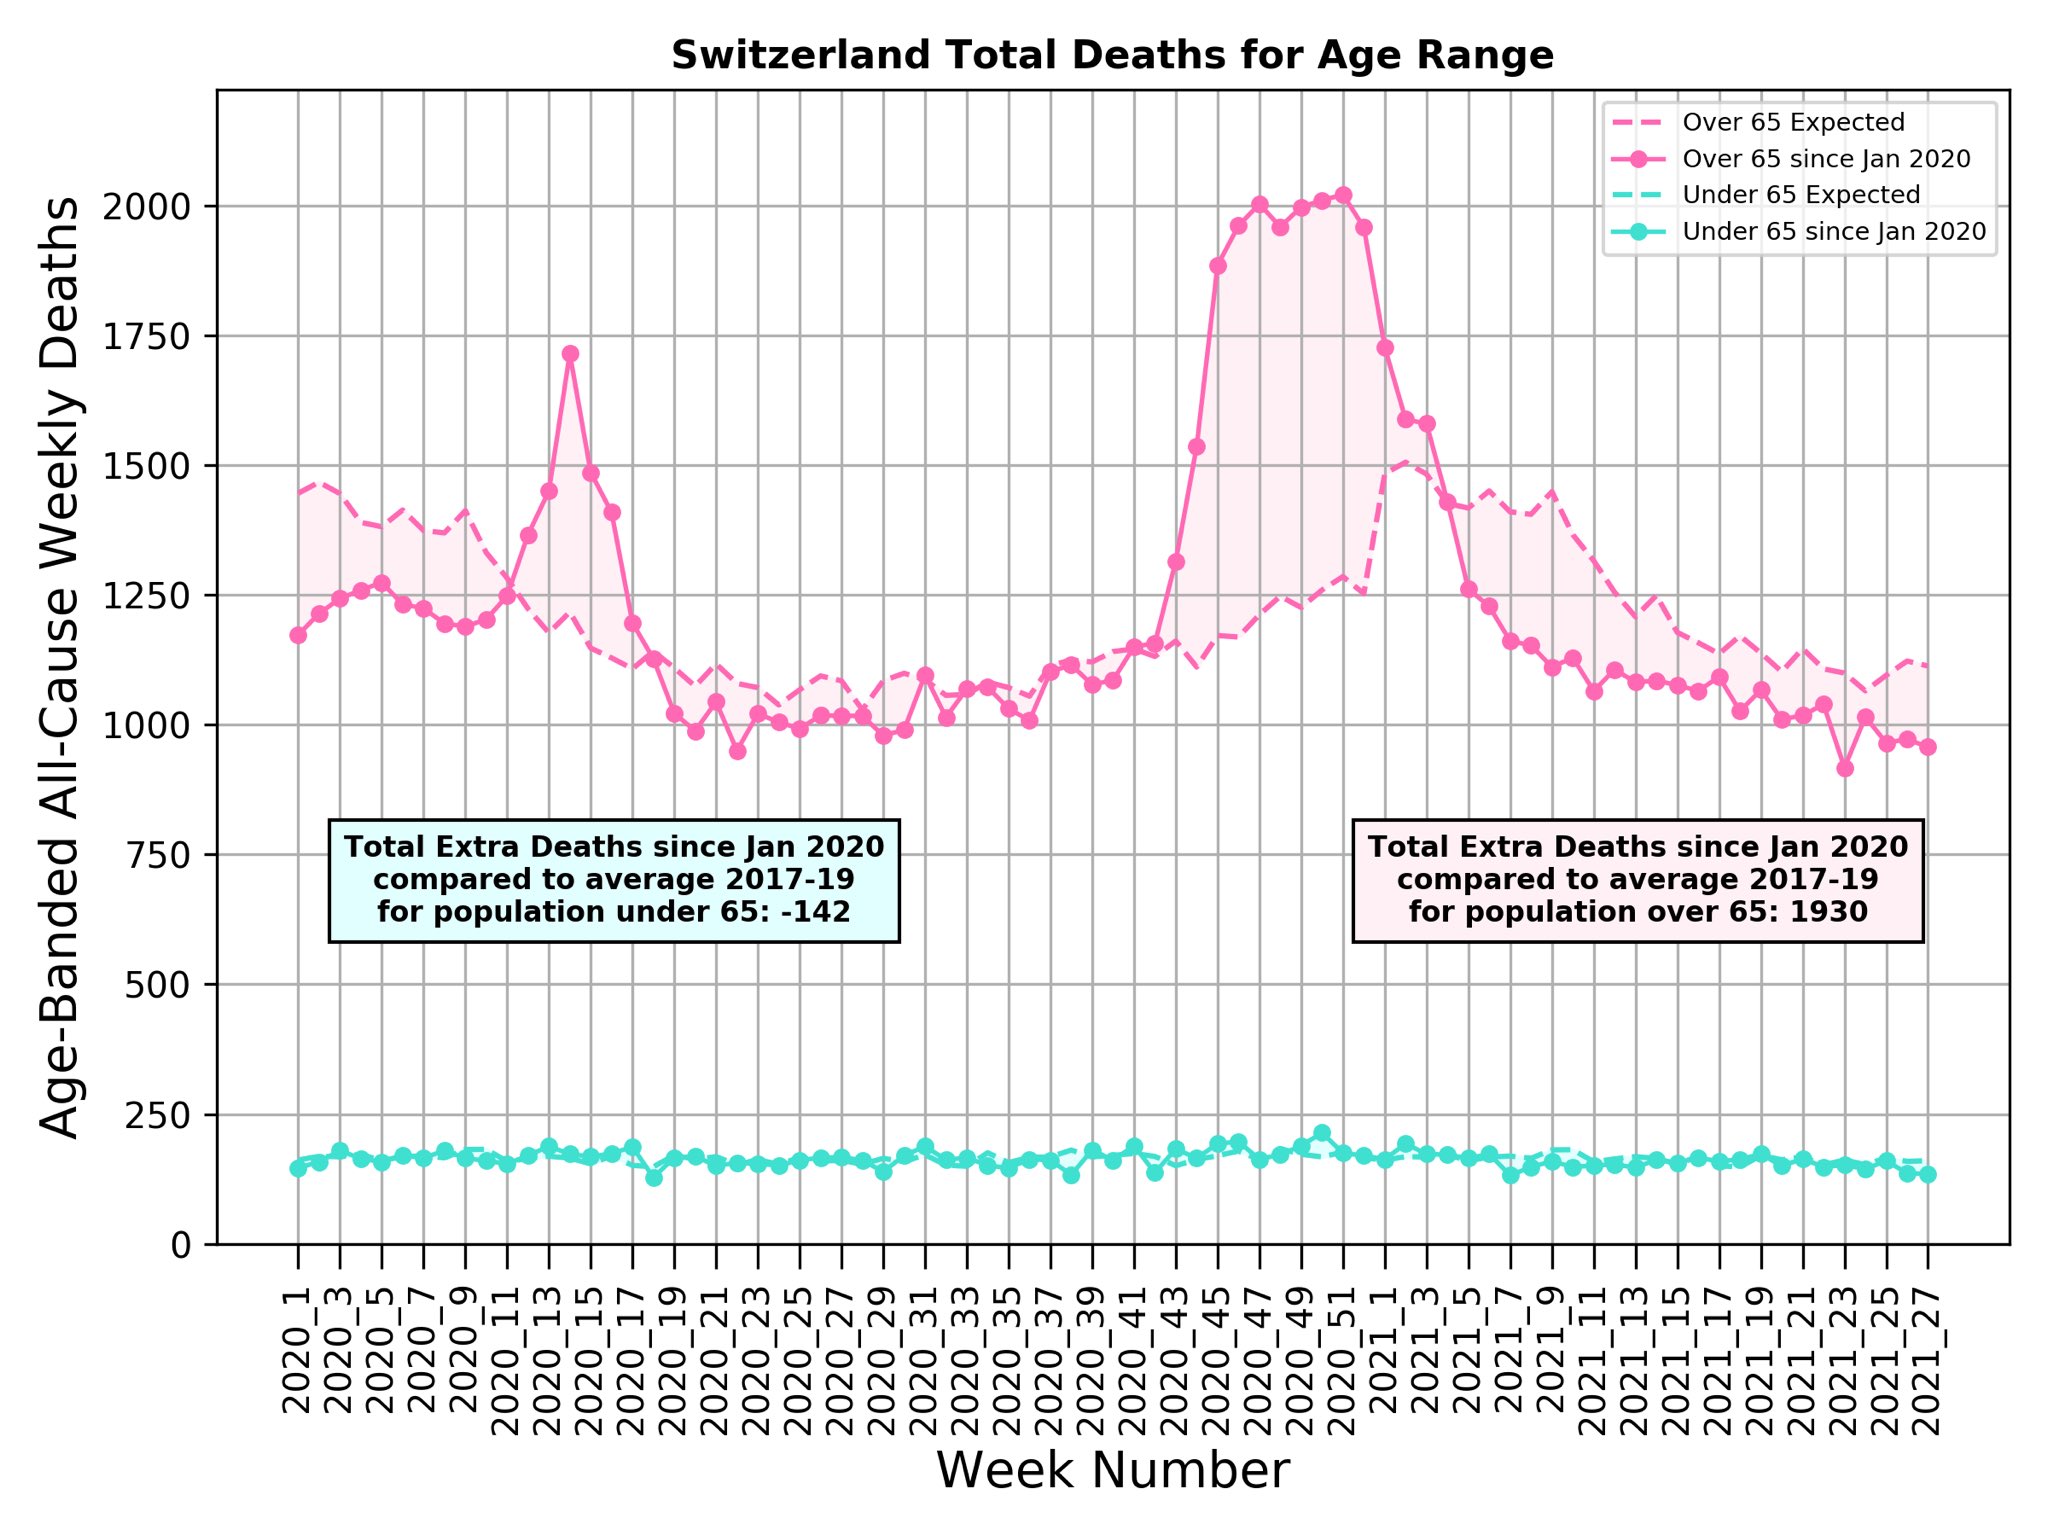
Switzerland age-adjusted estimate of natural death based on average mortality (deaths per million population) for 2017, 2018 & 2019. Data to week 27, 12-July-21.
Negative excess death since Jan. 2021 for young & elderly. Total over 79 weeks below 1,800 or 1.7% of ~10pK expected.
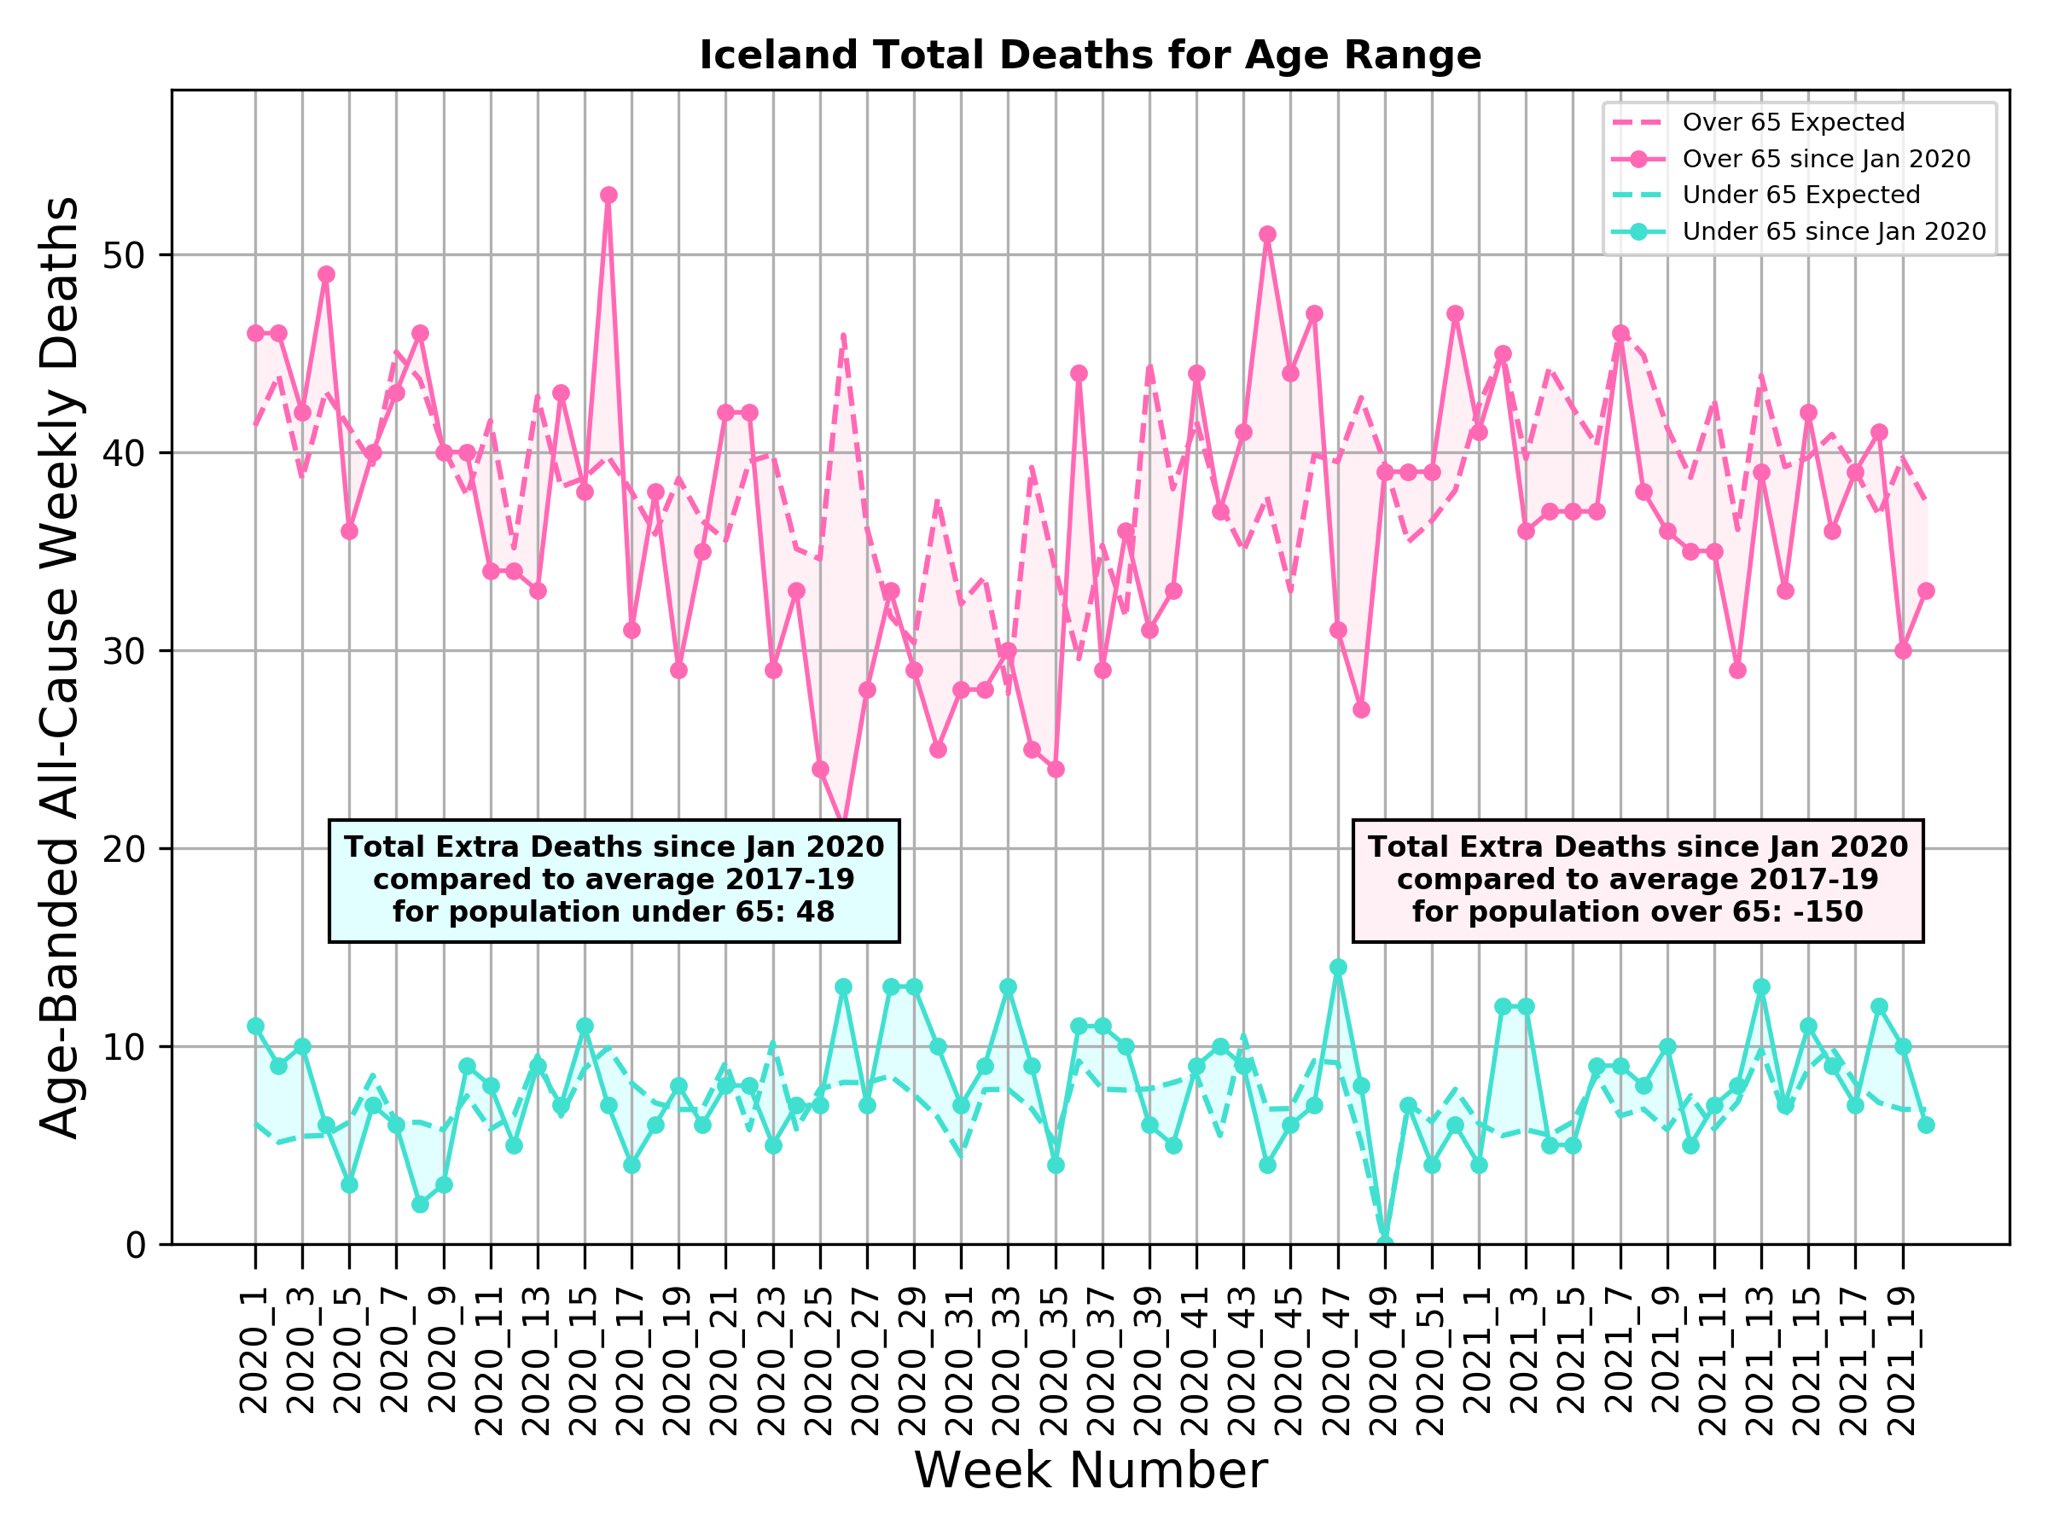
"All-cause death in Iceland still shows no excess. Do you think that there will eventually be noticeable excess deaths from this latest wave of cases?
Do you think that Sweden will also be hit with a Delta wave?"
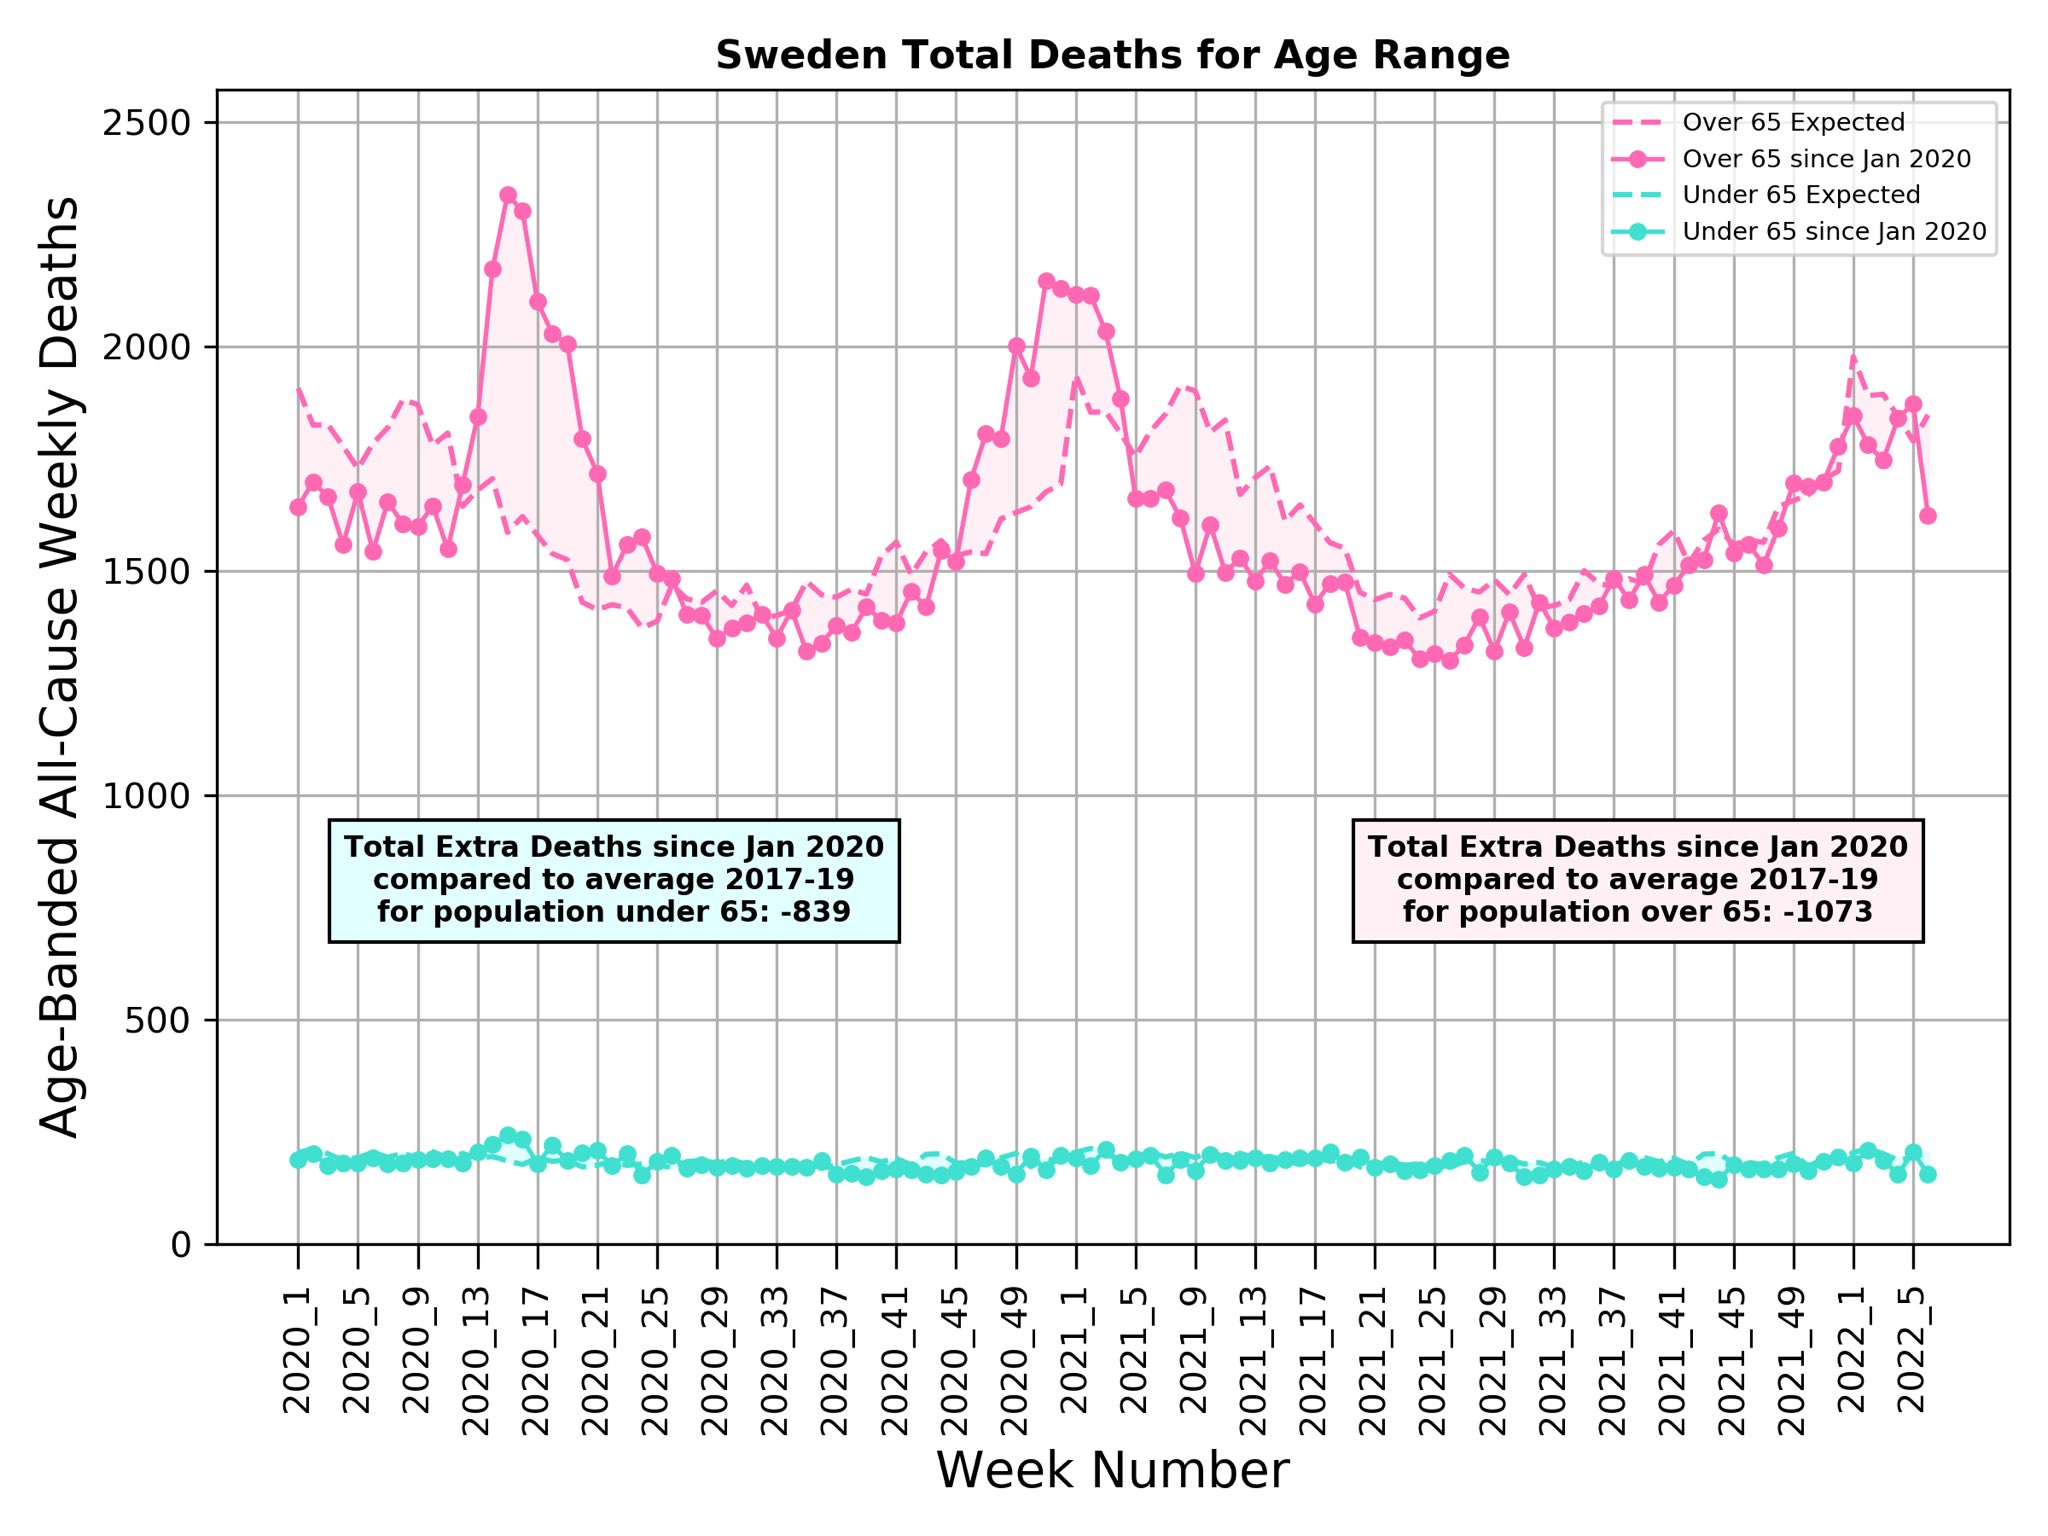
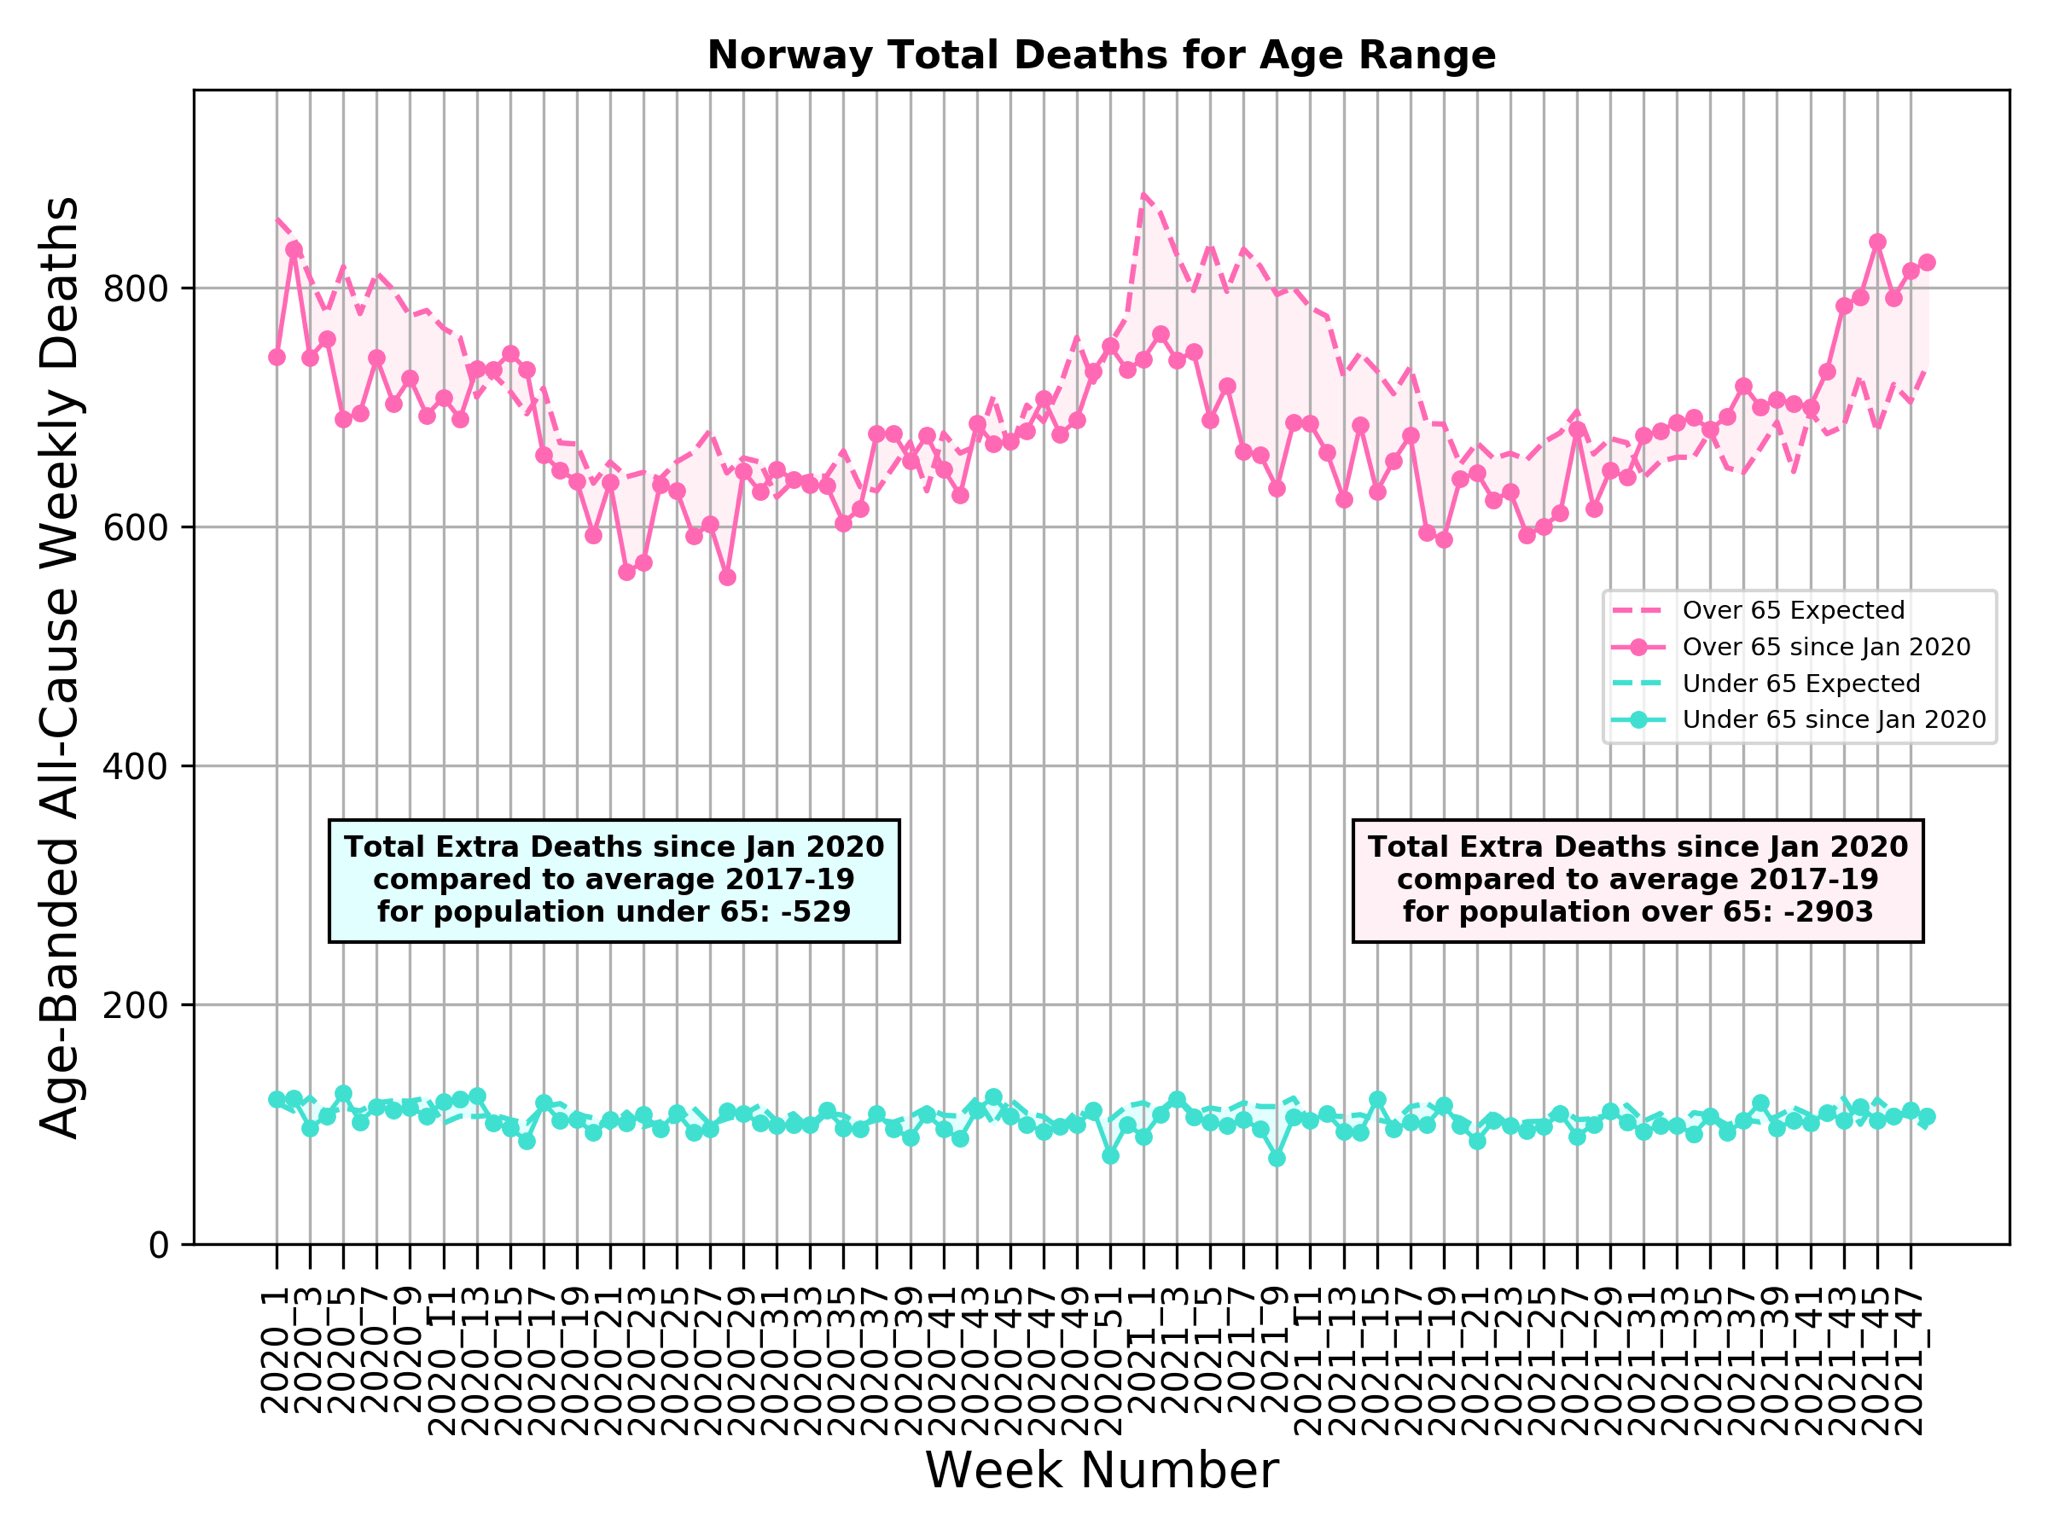
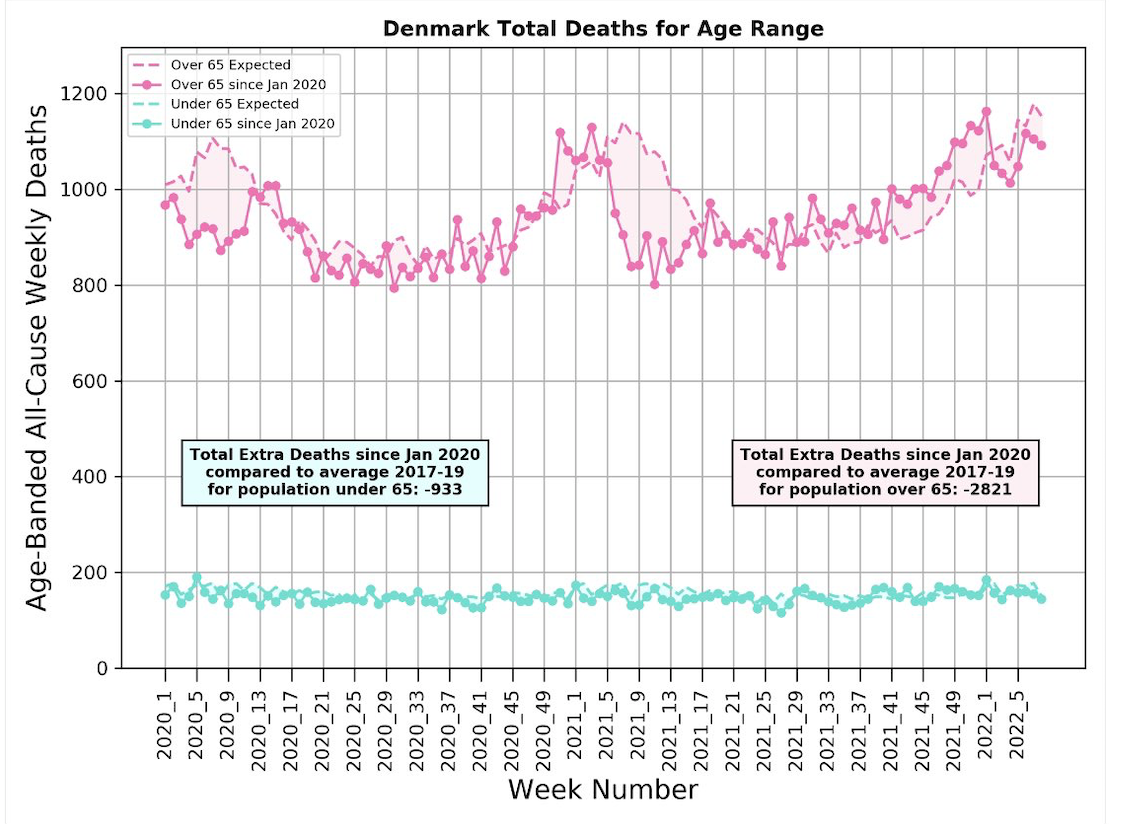
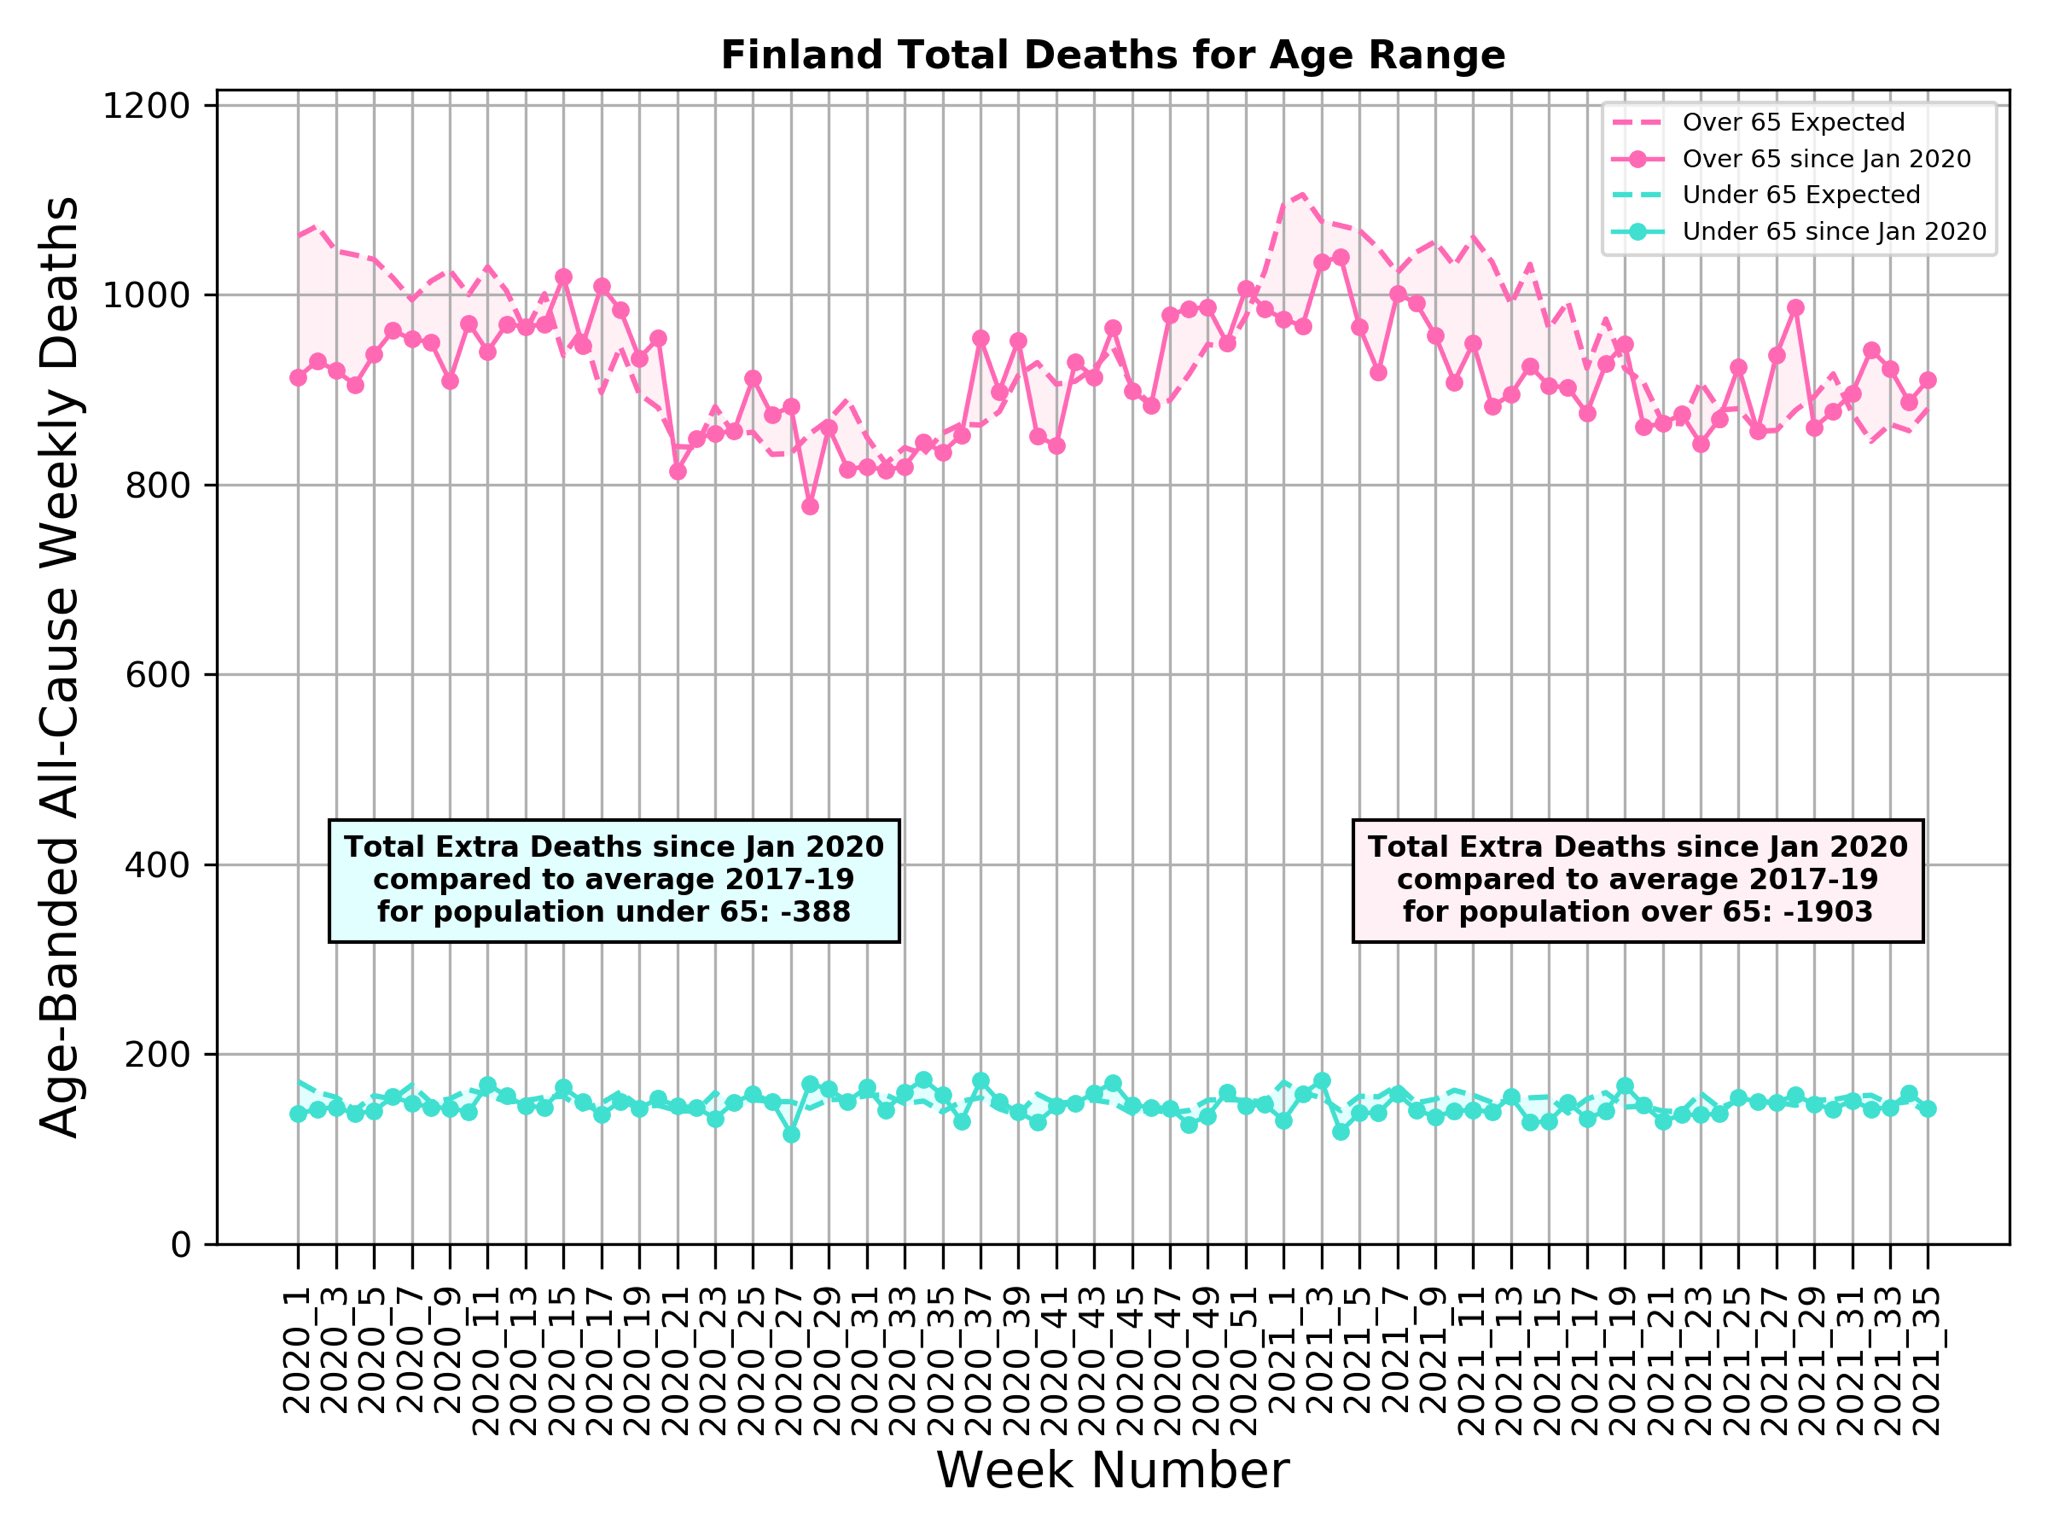
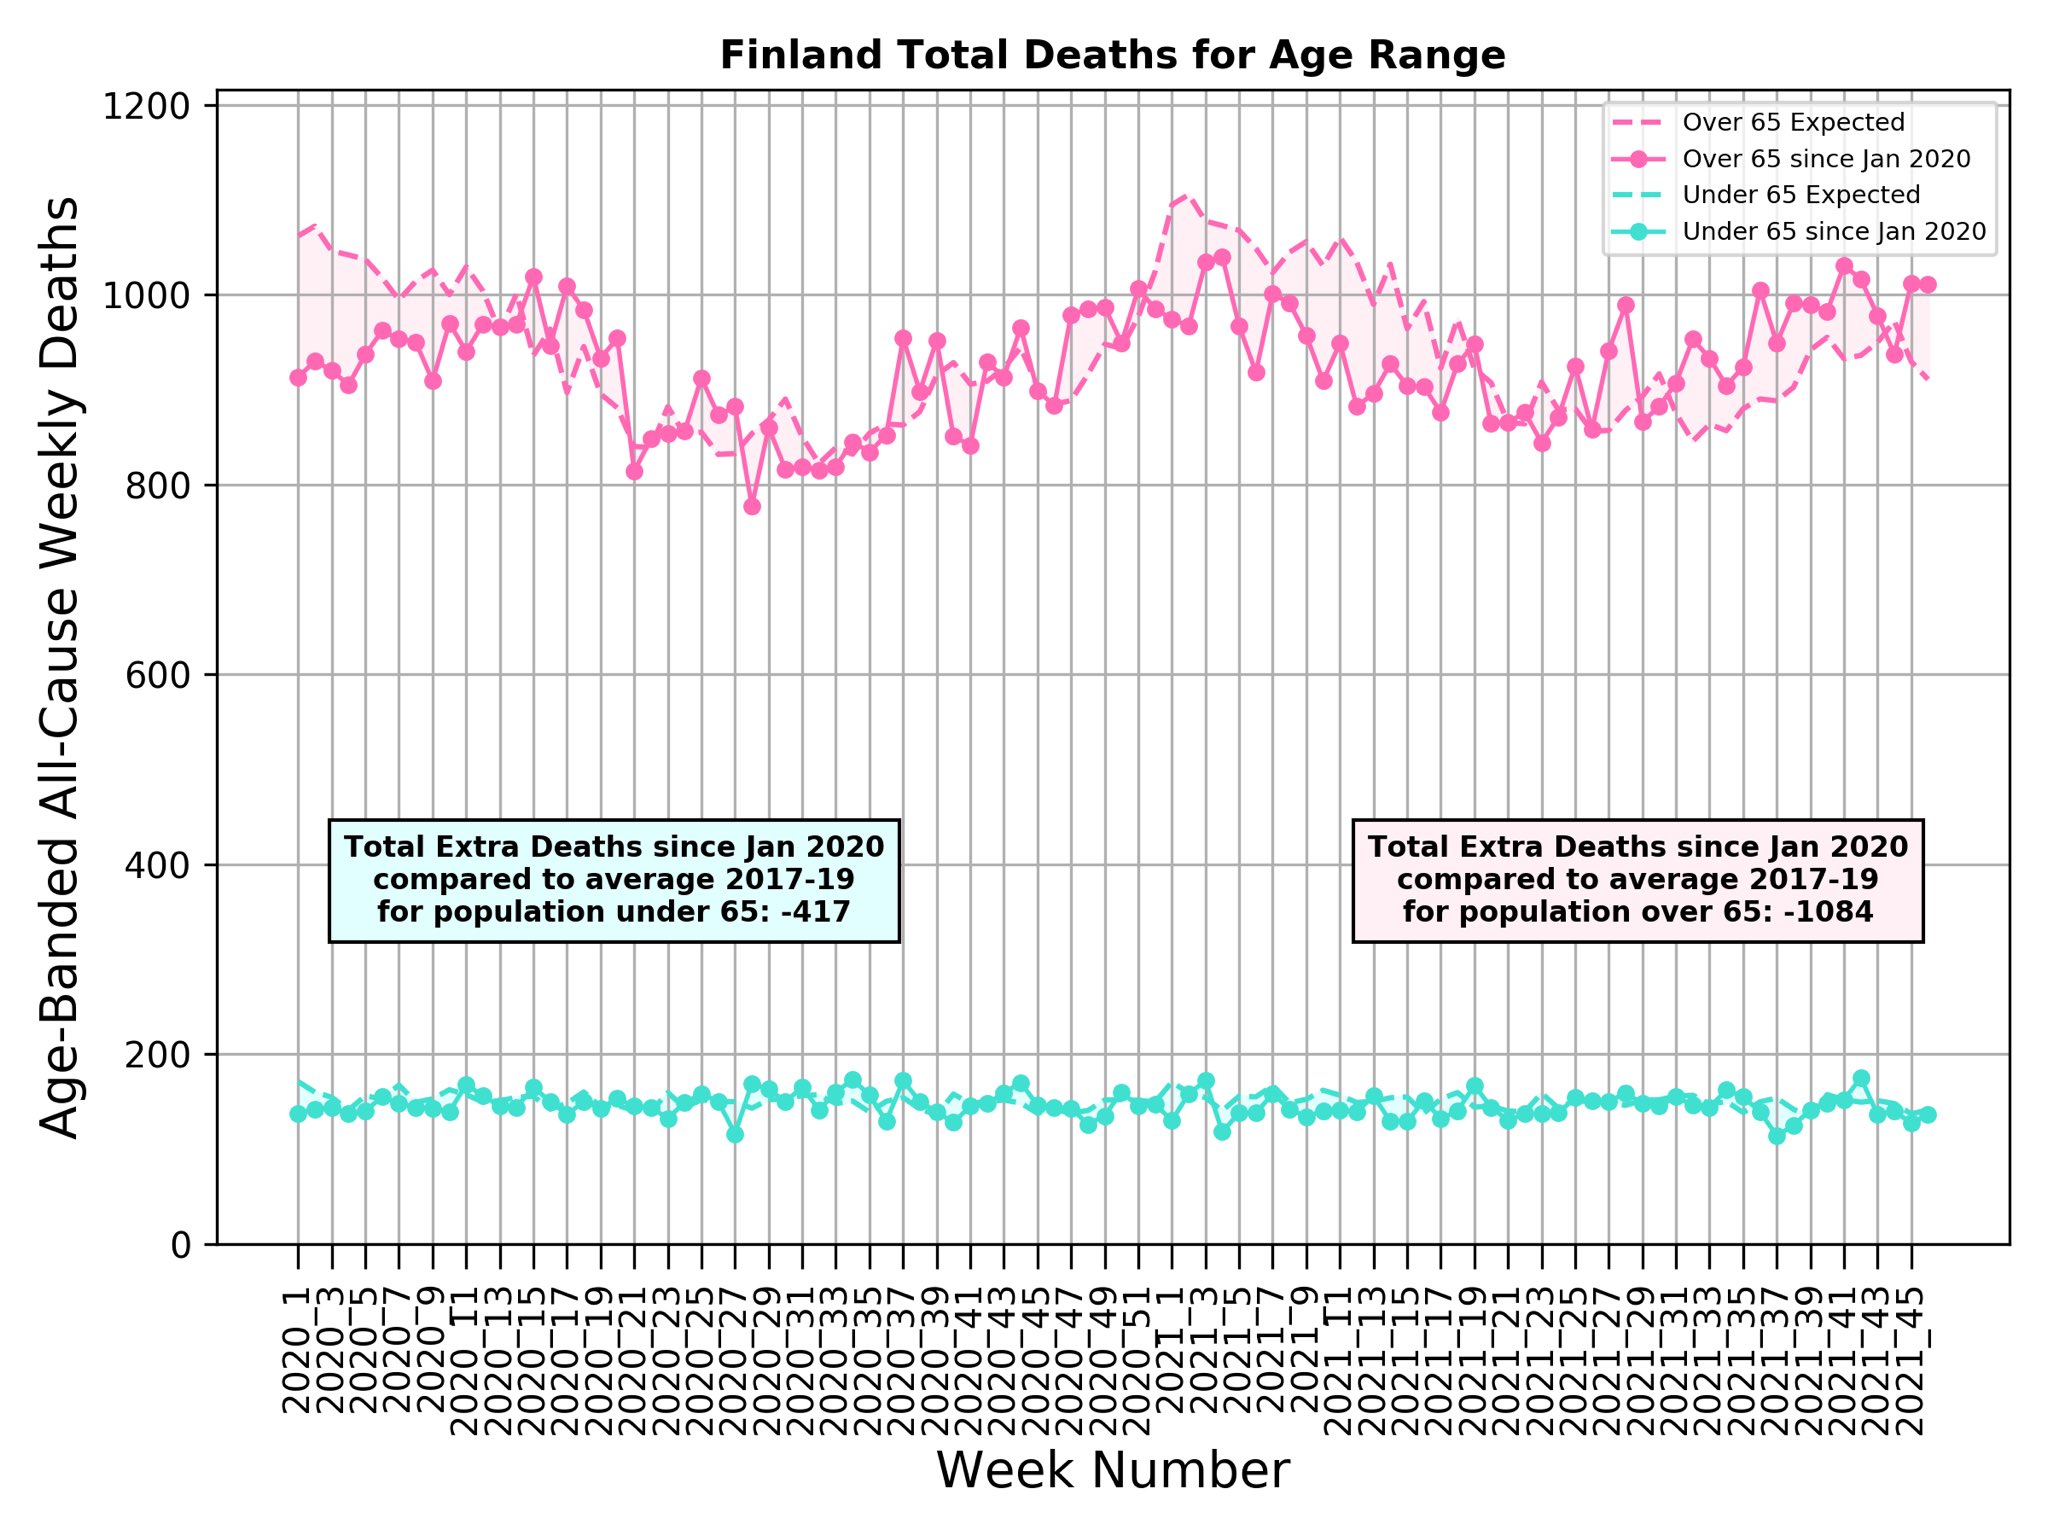
"Jan 21 mortality.org plots are not age-adjusted. During the two years of COVID-19, really very little age-adjusted (using http://mortality.org deaths & populations) all-cause excess death there or in Norway, Sweden & Finland.
"Dramatic!
http://mortality.org lacks age adjustment. With it, excess death, all 4 countries have clear death deficit in 2021.
Sweden is special as this deficit death continues until week 37, while there is small excess death in the last 6 weeks in the other three countries."
"Jan 21 mortality.org plots are not age-adjusted. During the two years of COVID-19, really very little age-adjusted (using http://mortality.org deaths & populations) all-cause excess death there or in Norway, Sweden & Finland.
"Jul 3 2021
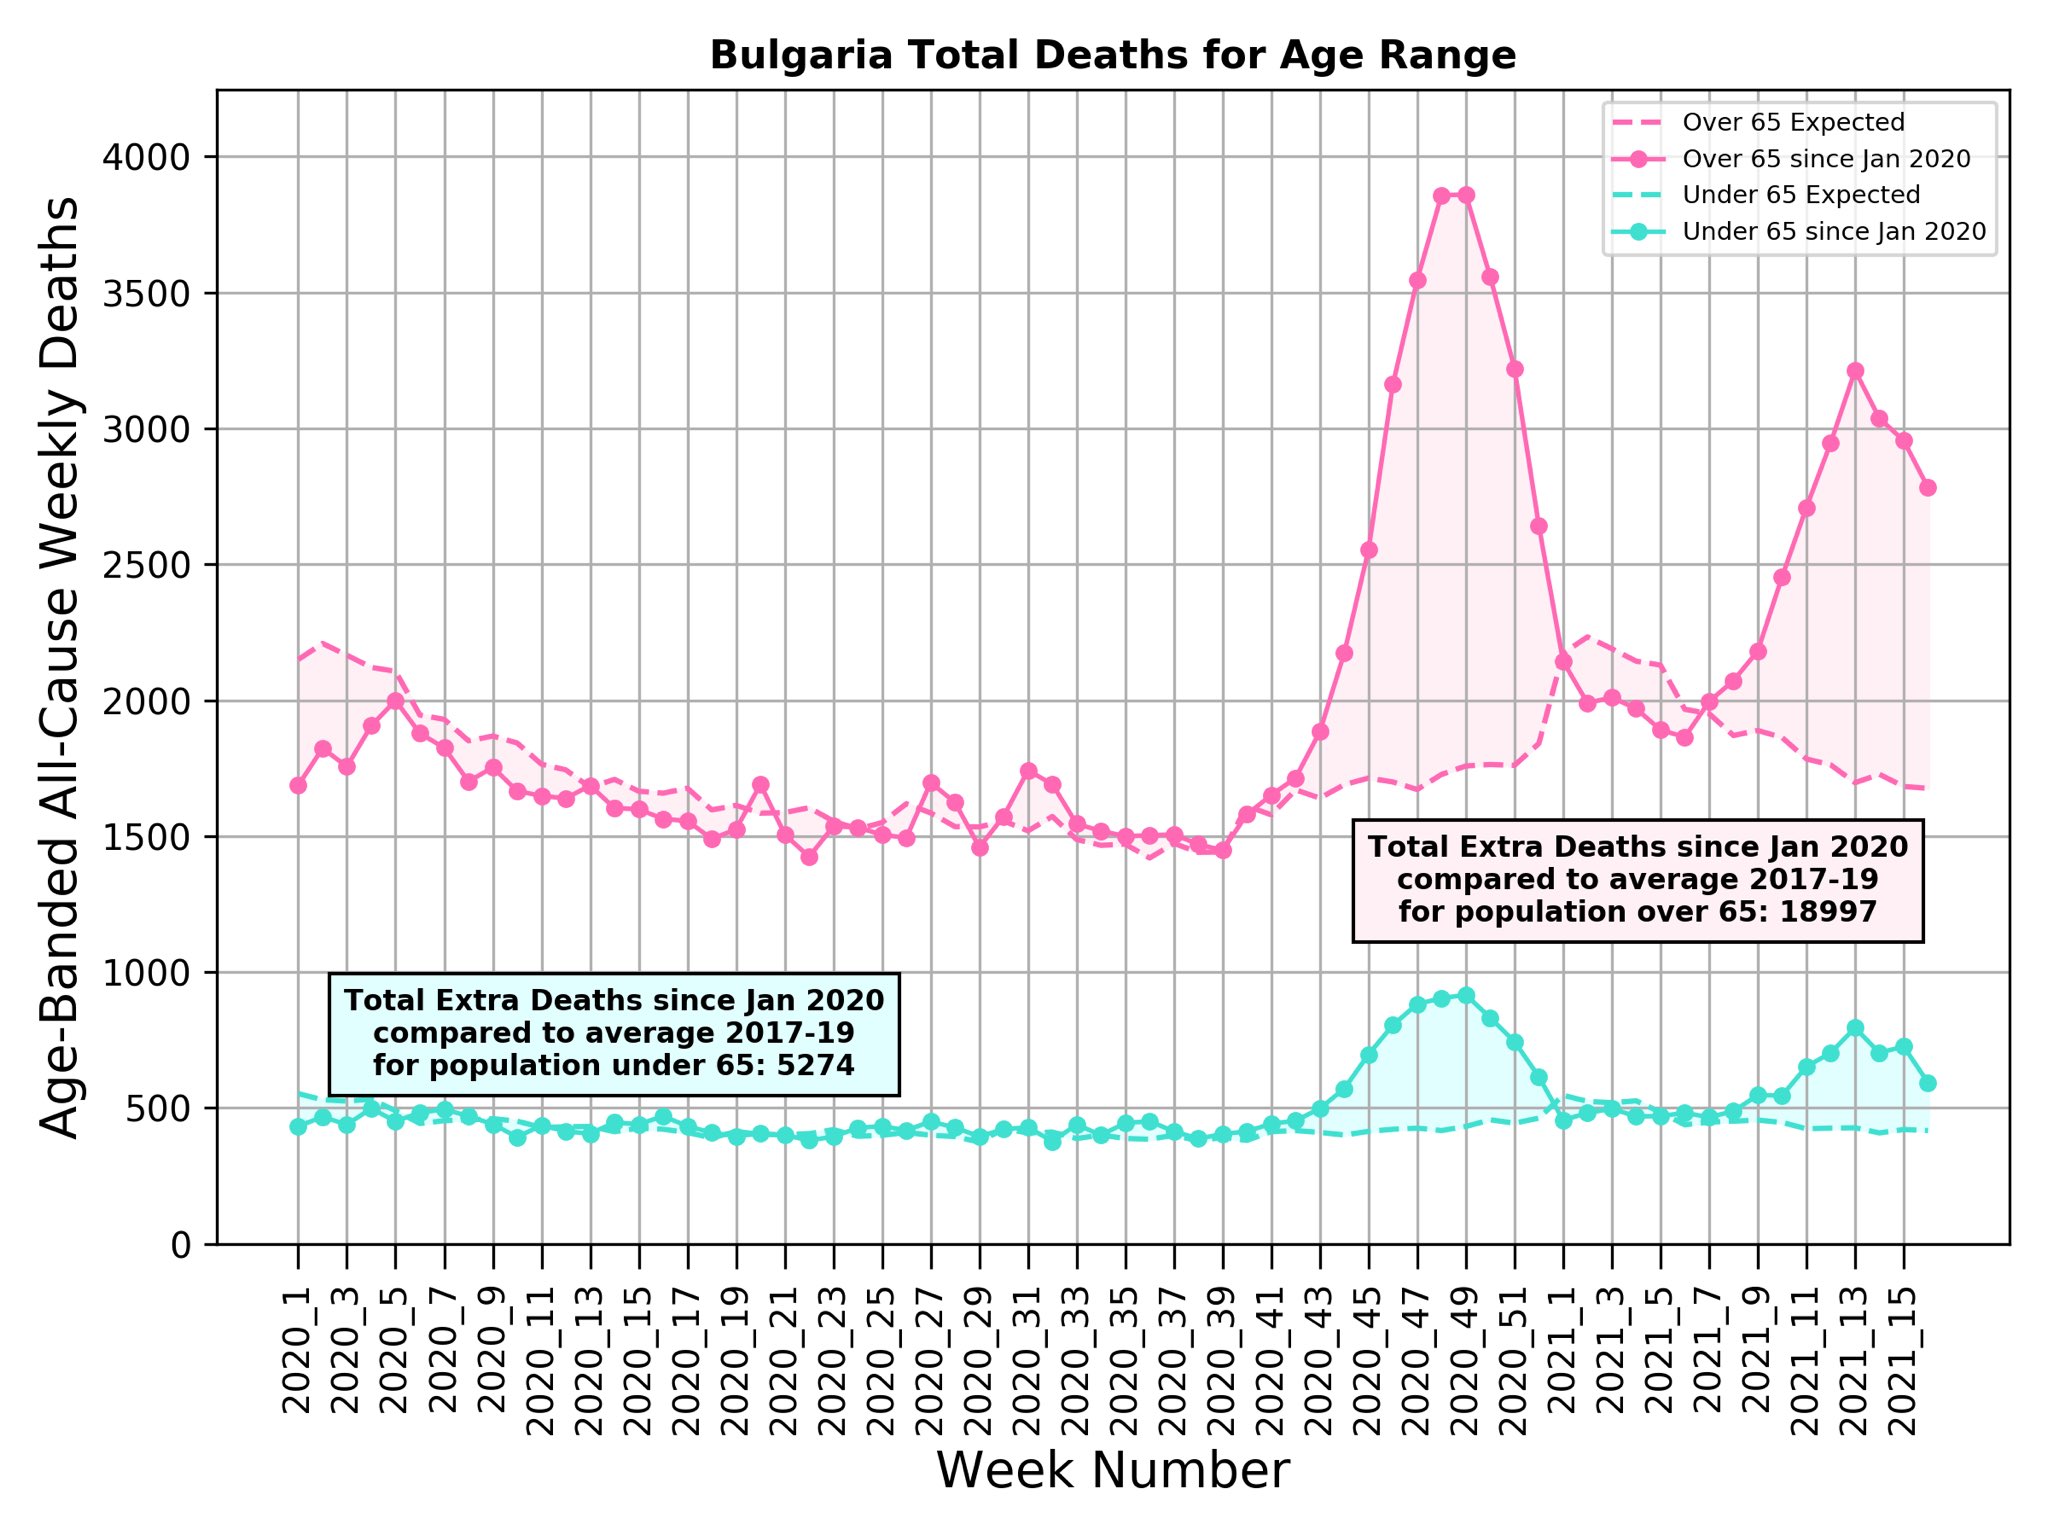
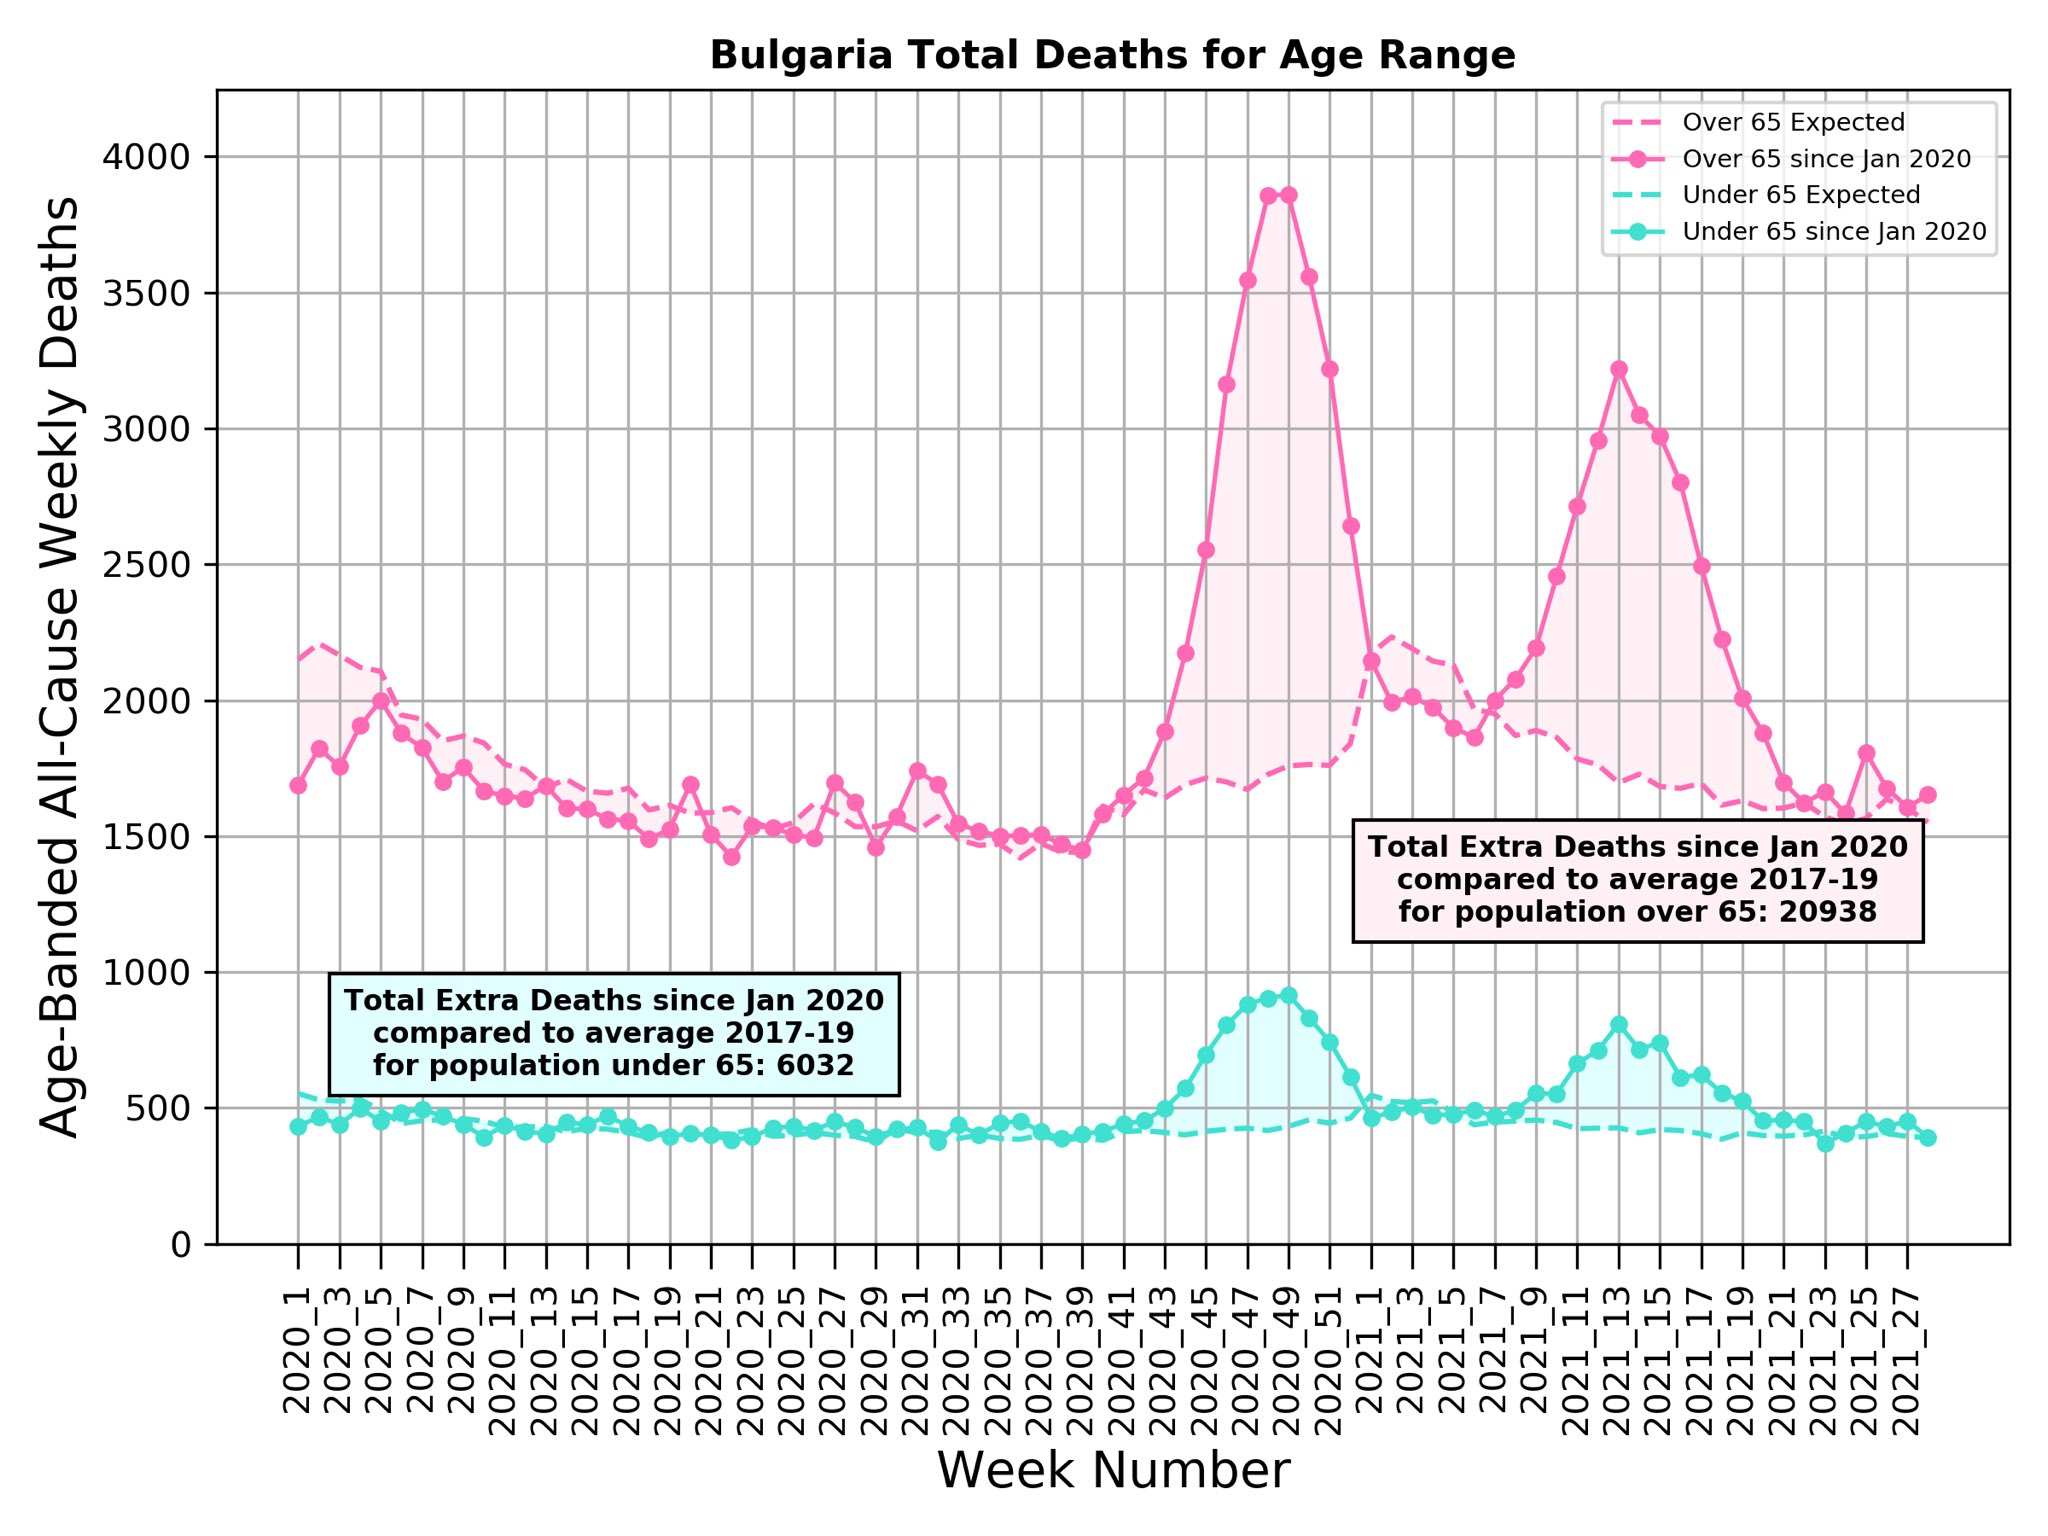
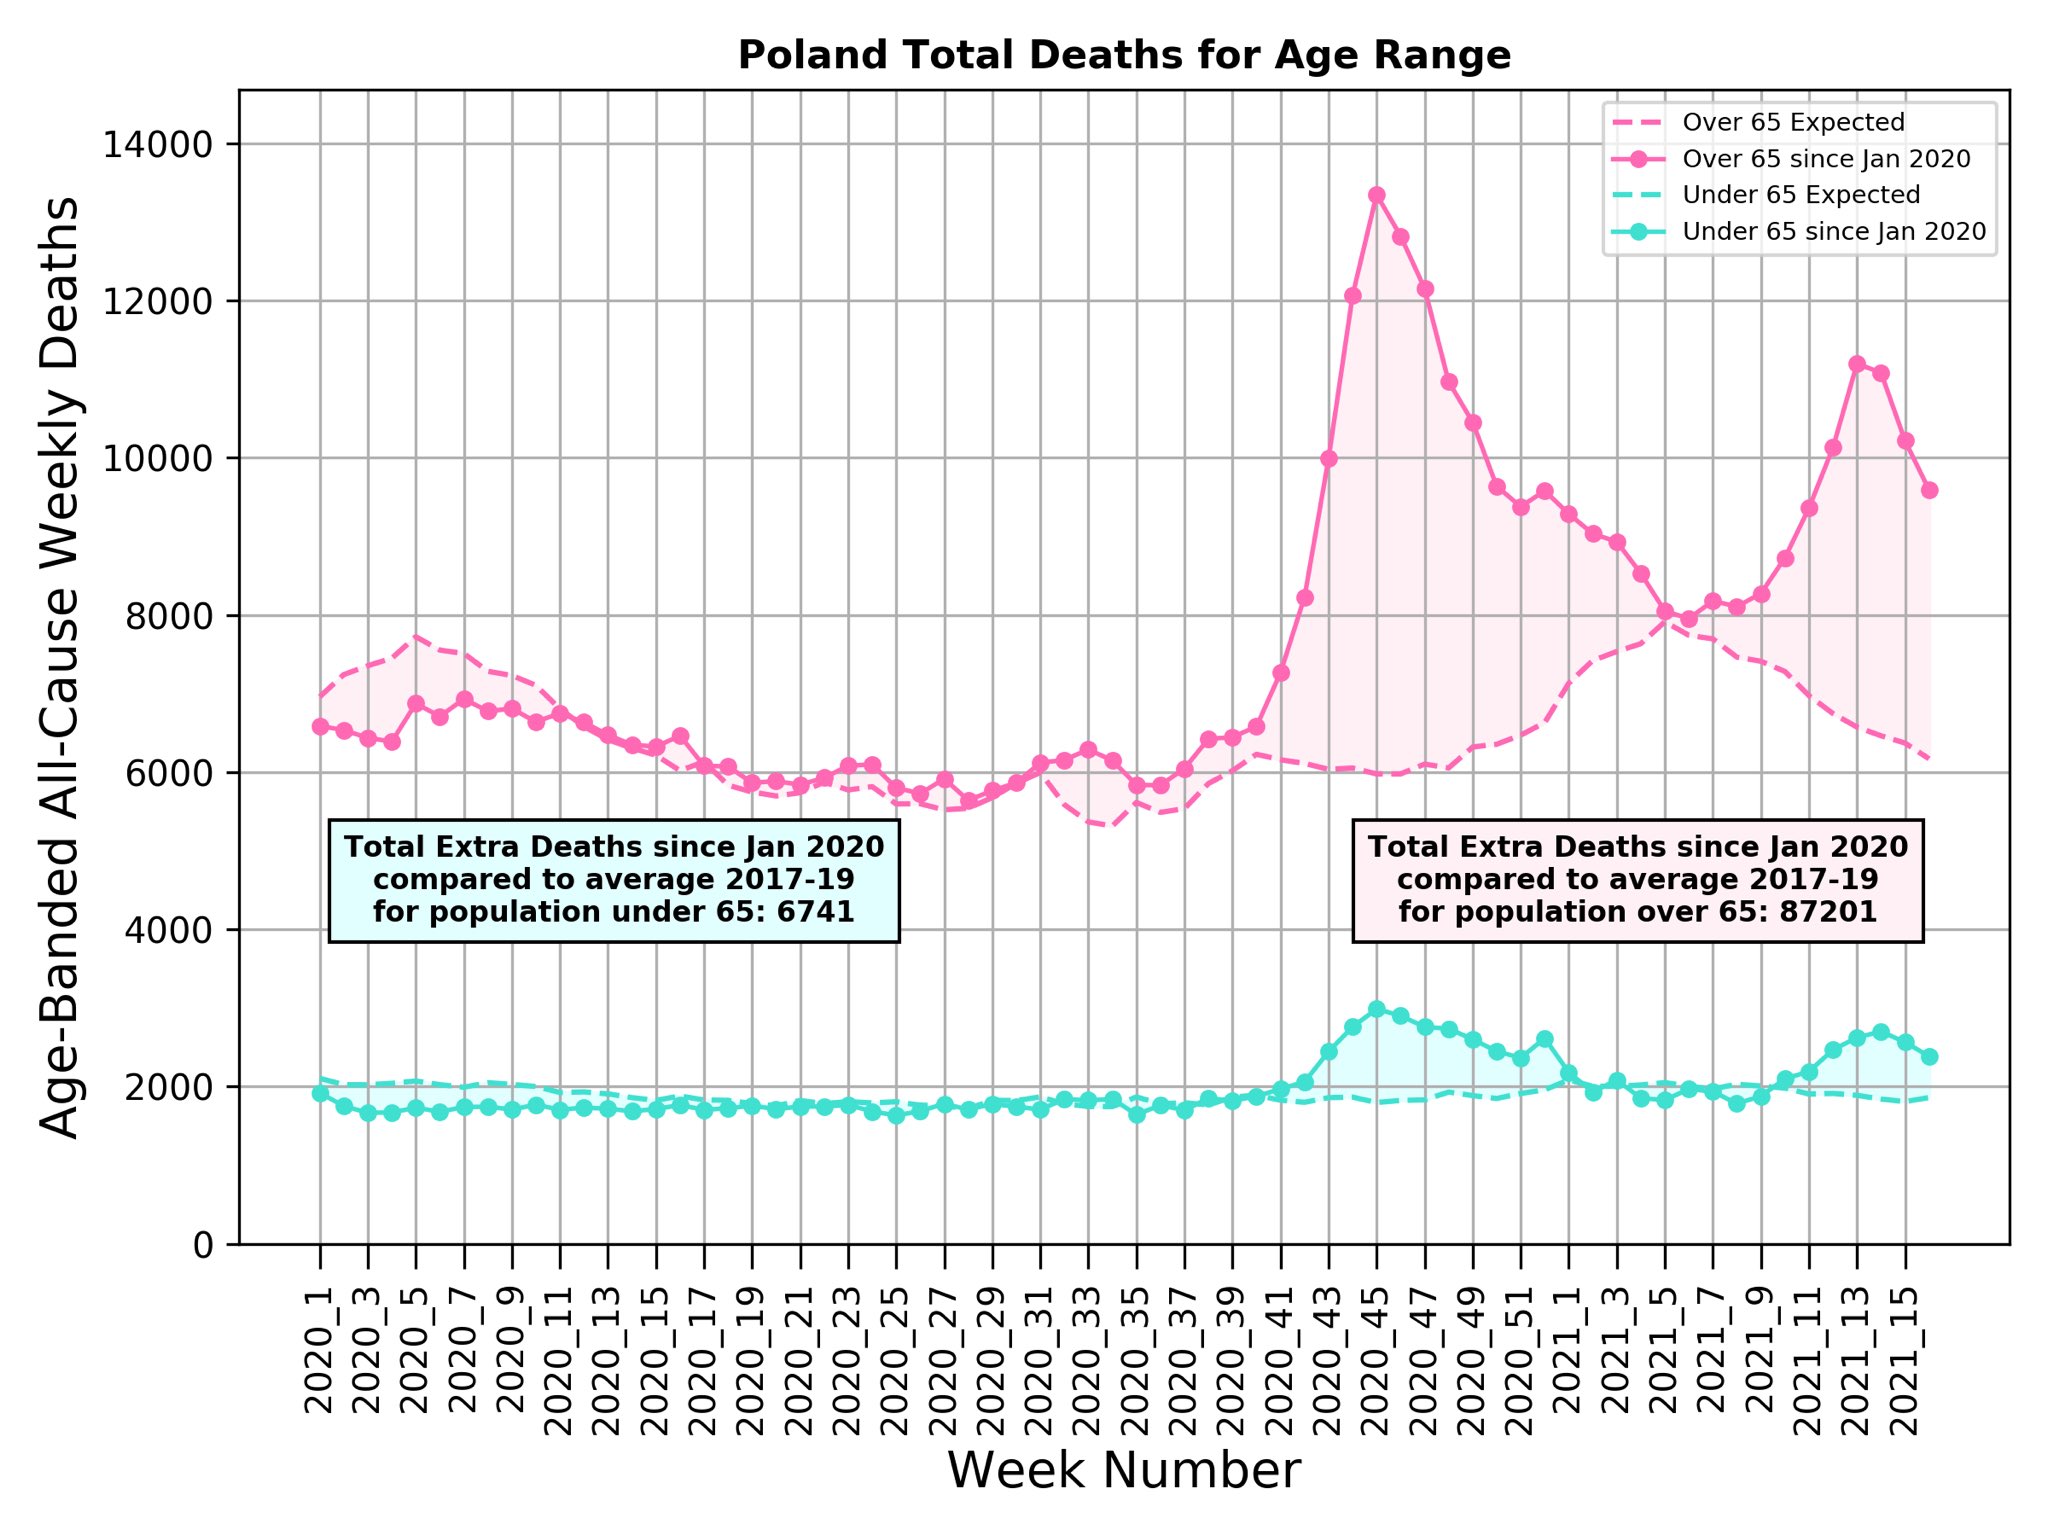
Only 40 countries have age-banded all-cause excess death collected by well-established academic group https://mortality.org
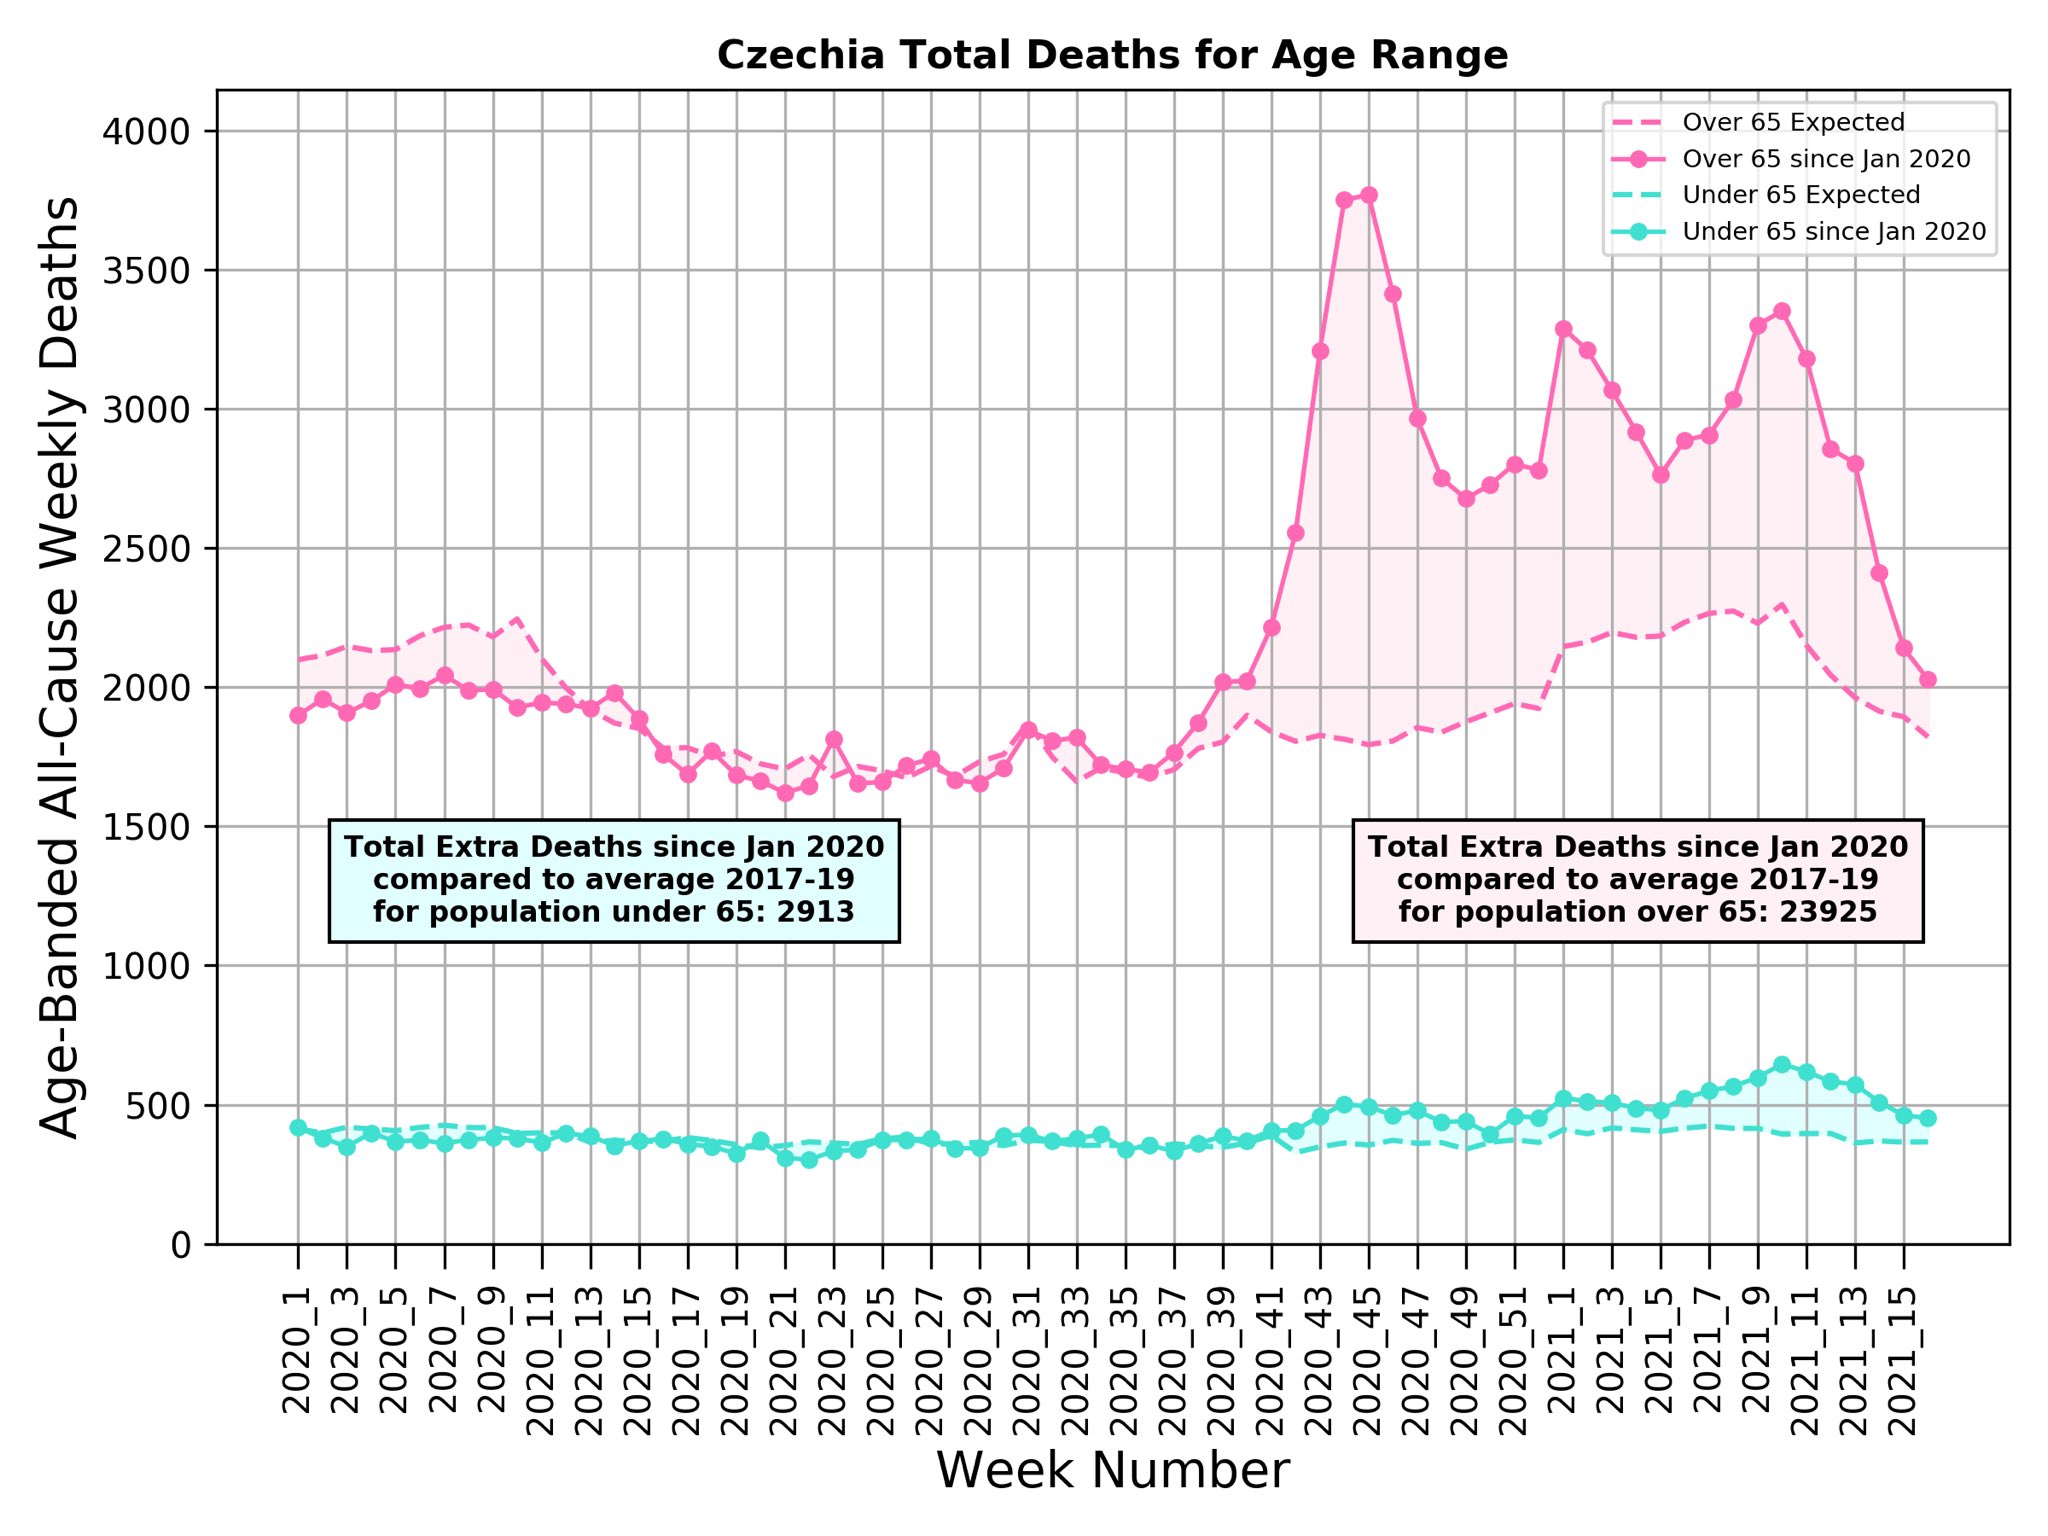
From the plots available without computer access, excess death below 65 is worst in Bulgaria, Czechia & Poland.
NYC is 5X more than Bulgaria, tge worst"
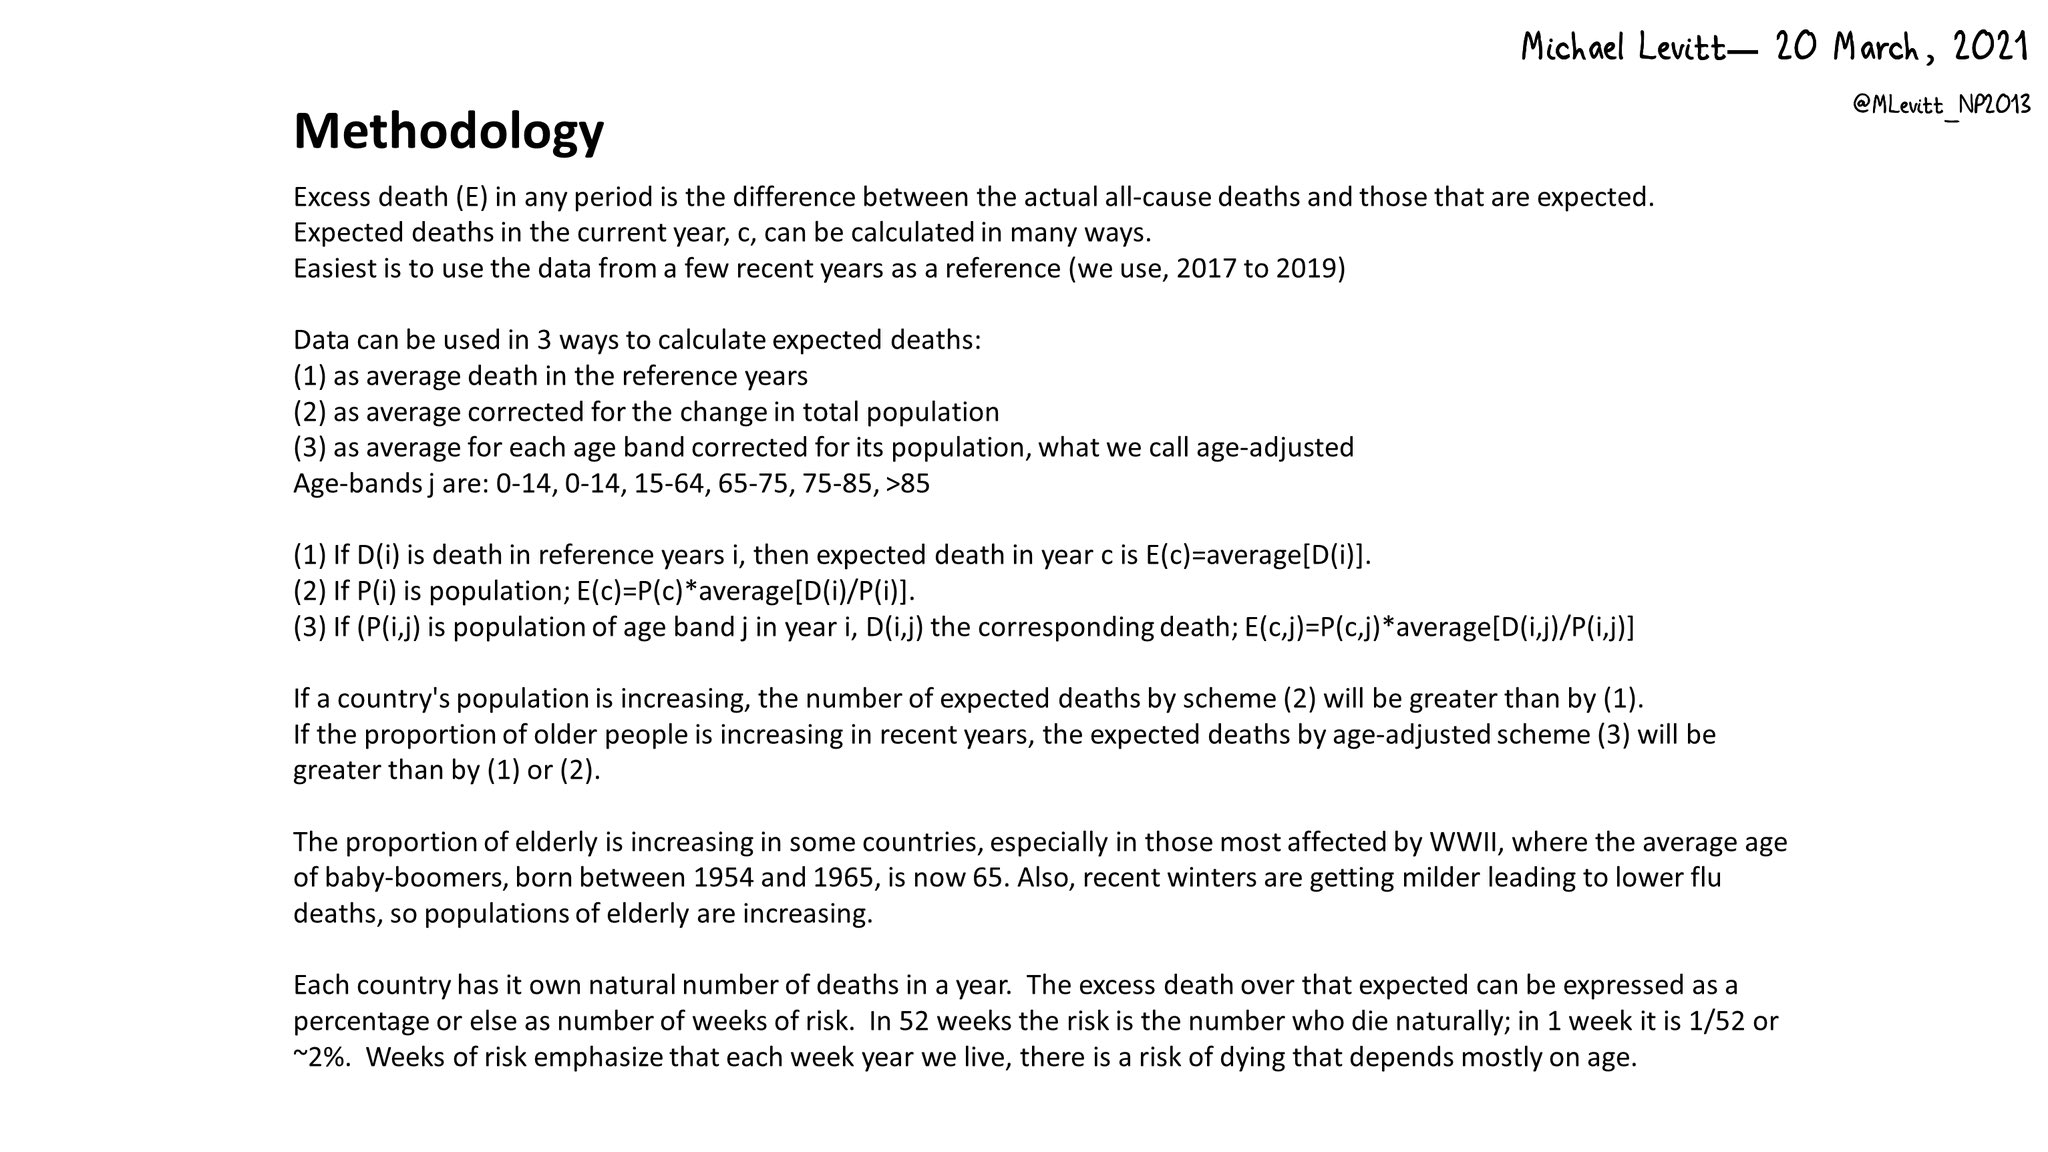
"Data can be used in 3 ways to calculate expected deaths.
(1) as average death in the reference years.
(2) as average corrected for the change in total population.
(3) as average for each age band corrected for its population, what we call age-adjusted.
(1) If D(i) is death in reference years i, then expected death in year c is E(c)=average[D(i)].
(2) If P(i) is population; E(c)=P(c)*average[D(i)/P(i)].
(3) If (P(i,j) is population of age band j in year i, D(i,j) the corresponding death; E(c,j)=P(c,j)*average[D(i,j)/P(i,j)]
If a country's population is increasing, the number of expected deaths by scheme (2) will be greater than by (1).
If the proportion of older people is increasing in recent years, the expected deaths by age-adjusted scheme (3) will be greater than by (1) or (2).
We use (3).
The proportion of elderly is increasing in some countries affected by WWII, where the average age of baby-boomers, born between 1945 and 1965, is now 65.
Also, recent northern winters have been milder leading to lower flu deaths, so populations of elderly are increasing.
Each country had number of natural deaths a year. Excess death can be expressed either as a percentage or as number of weeks of risk (1 week is 1/52 of the annual deaths or ~2%). Weeks of risk help show that each week year we live, there is an age-dependent risk of dying.
This is by far my most complicate Tweet. It was produced using a template from Jose Gefaell
@ChGefaell using graphs made by @andreascaie Jose also taught me how to embed the plots in a slide show. Thanks to both."
SOURCES
all-cause deaths and populations of countries, regions and New York City are from mortality.org
all-cause deaths of individual US states are from the Center for Disease Control (CDC)